


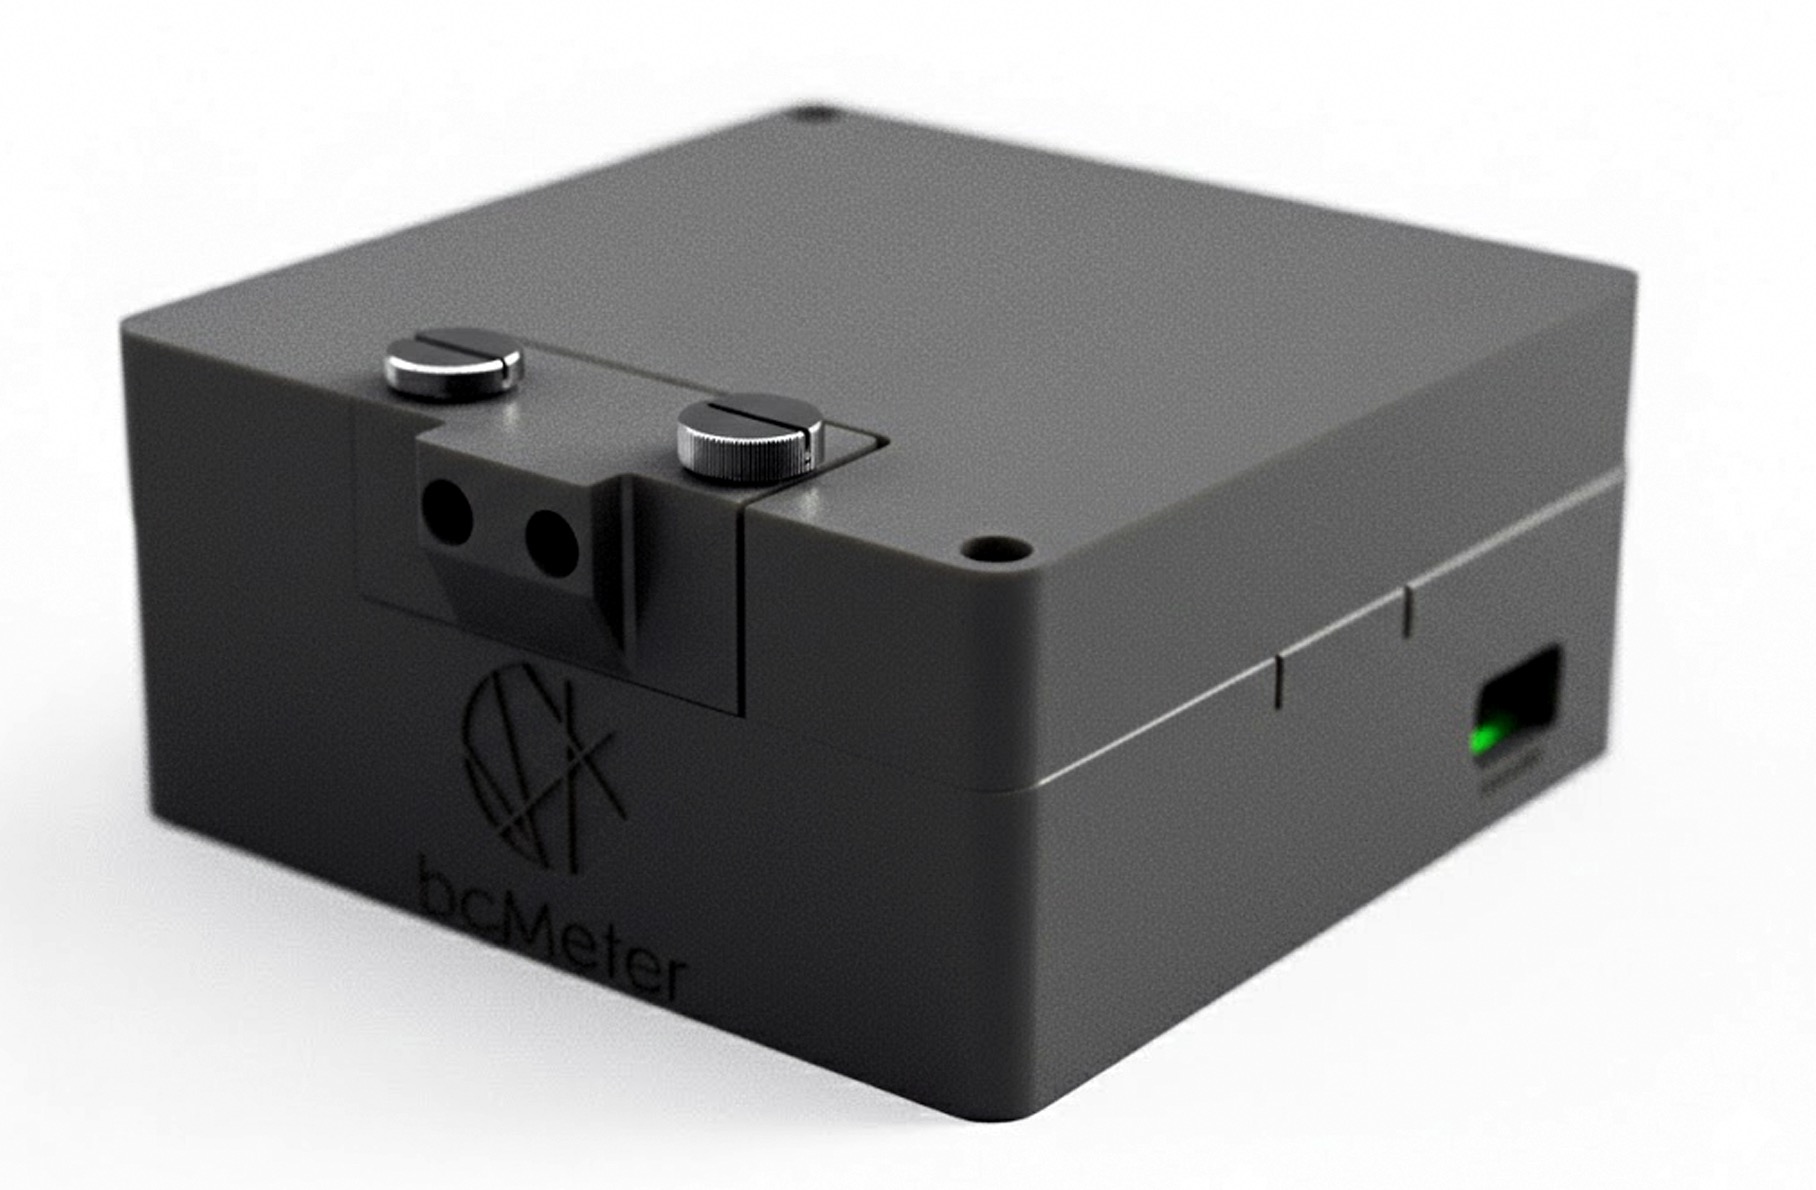
User Manual
Monitoring Black Carbon
Table of Contents
1. Introduction
The bcMeter is an optical absorption photometer for measuring Black Carbon (BC), or soot, in ambient air.
The device has no built-in screen. It serves a local web page that opens on a smartphone or computer in the same network.
A Quick Start Guide / Cheat Sheet is available alongside this manual.
2. Setup & Initialization
2.1 Requirements
- Use the power supply shipped with your device. bcMeter Kit and Complete use 12V / 2A (or USB-C PD).
- Use a short, low-resistance cable (ideally under 40cm). Long or thin cables can drop enough voltage to reboot the device when the pump starts or cause WiFi dropouts.
2.2 Receiving a Rugged Case Device
If your device is not installed in a rugged case, skip the case-specific steps and continue with Section 2.3.
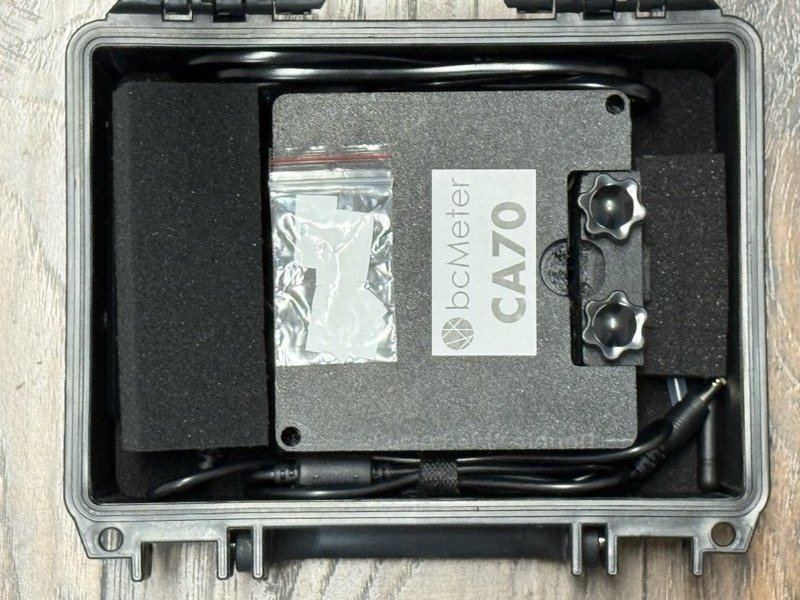
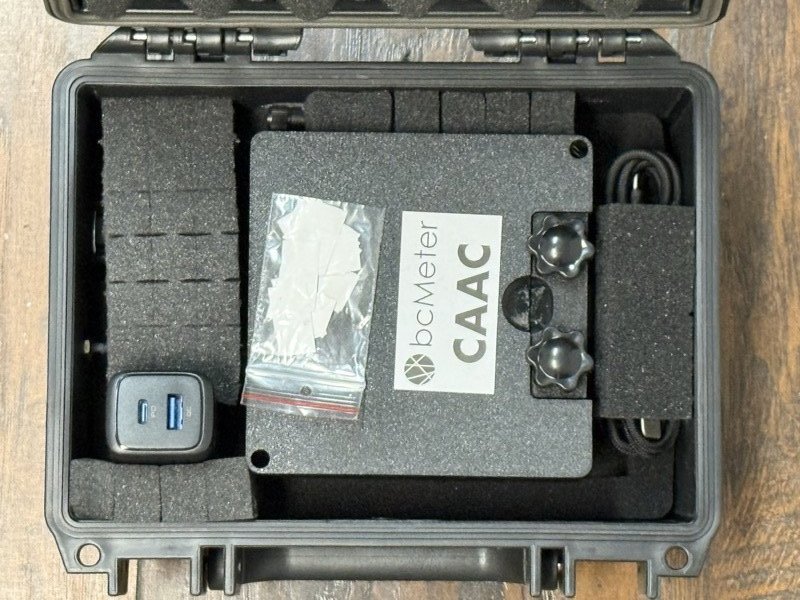
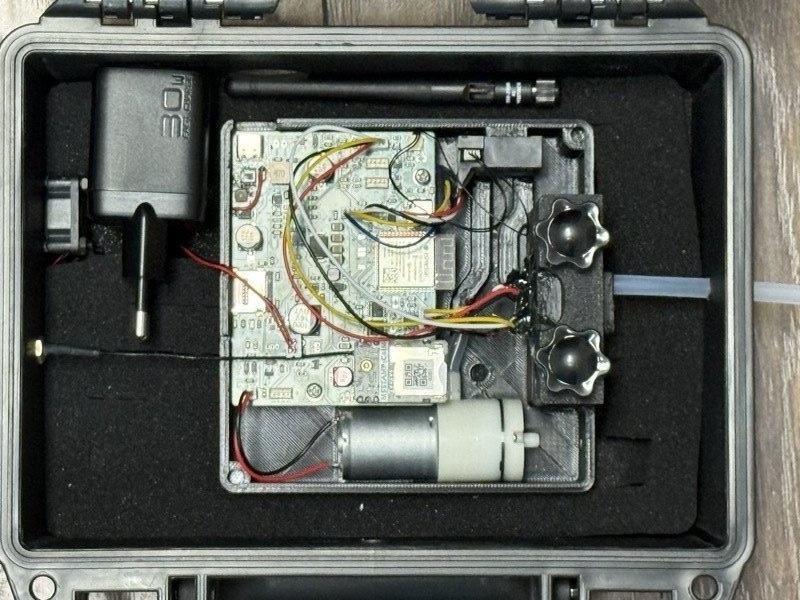
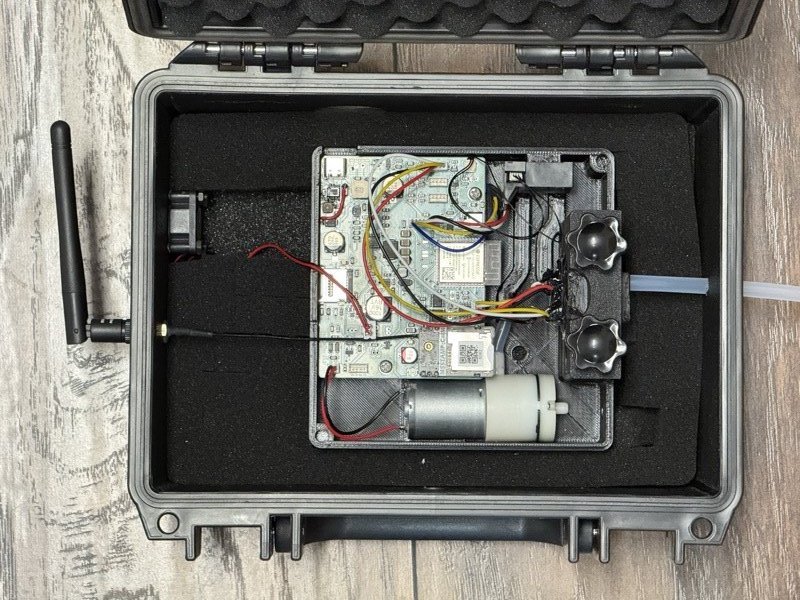
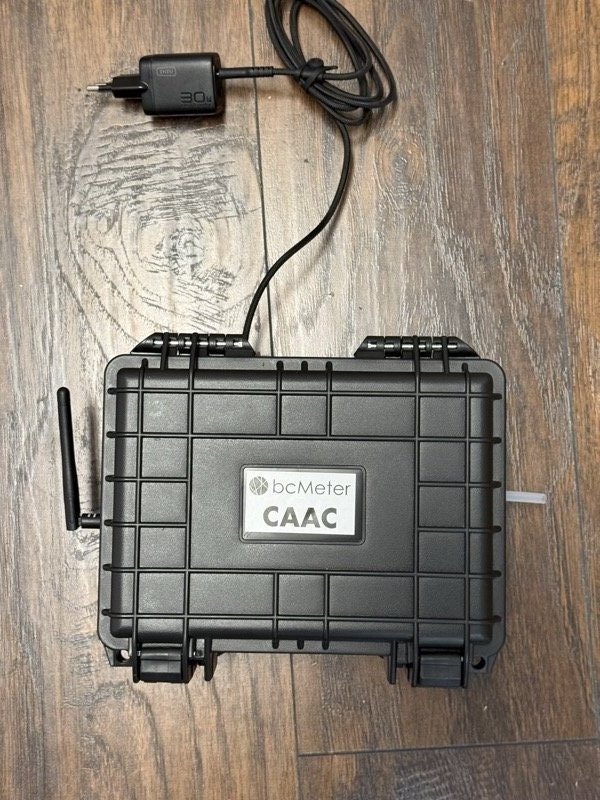
- Open the case latches and check the contents: bcMeter unit, matching power supply, air inlet tube, antenna if supplied, and filter papers in small plastic bags.
- Inspect the housing, air inlet, outlet hose, power connector, antenna connector, and filter holder. Do not start a measurement if anything is cracked, loose, disconnected, or blocked.
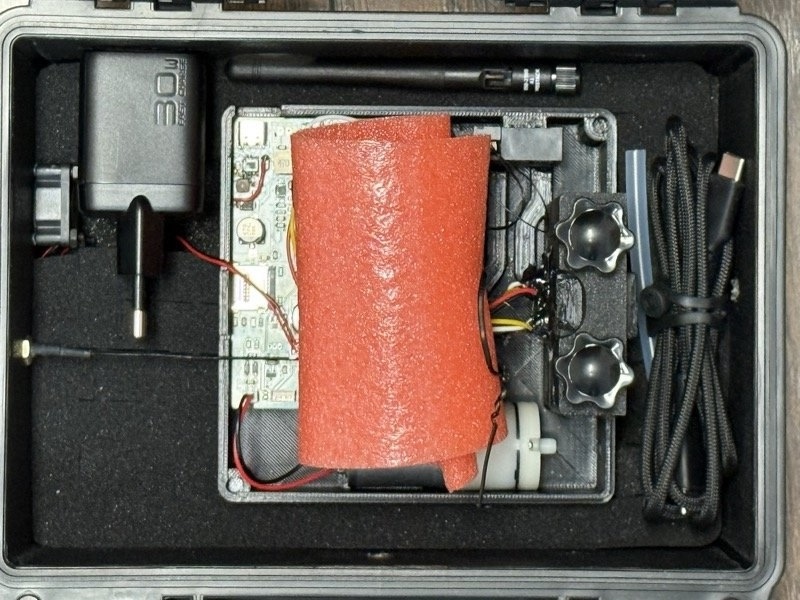
- Remove loose foam padding or transport protection from the inside of the case. Do not pull on wires or remove fixed foam parts; if the protection is trapped under cables, contact support before powering the device.
- Connect the air inlet tube to the case-side inlet. The tube should sit firmly and should not be kinked or squeezed by the lid.
- If the device has a cellular modem, screw the 4G antenna onto the SMA connector by hand. Do not use tools to tighten it.
- Route the power cable through the cable opening, connect the matching power supply, and close the lid. Once powered, the bcMeter starts its setup hotspot if no known WiFi is available.
2.3 Initial Device Setup
Before starting, do this quick check:
- Confirm that the supplied power adapter matches the hardware (see Section 2.1) and that the device starts without repeated reboots.
- Place the device away from direct heat sources and sunlight (thermal drift affects optical measurements).
- If you use a case, check that the hose from bcMeter to the outside air is firmly inserted and not blocked.
- Insert a fresh filter paper (marked or rough side facing up - see Section 5.1). On bcMeter Complete units this is already done on delivery.

2.4 Connecting via Hotspot
The device can create its own WiFi network. It does this on first boot and whenever no known network is available. You can also enable the hotspot later in Settings.
- Plug in the device.
- Wait 1-2 minutes for the system to boot; the dim blue LED starts to slowly blink.
- On your tablet or computer, search for a WiFi network whose name starts with bcMeter.
Apple Users: If already connected to another WiFi, the bcMeter hotspot will appear under the "Other Networks" submenu. macOS may take up to a minute to scan for new networks even after the device has finished booting.
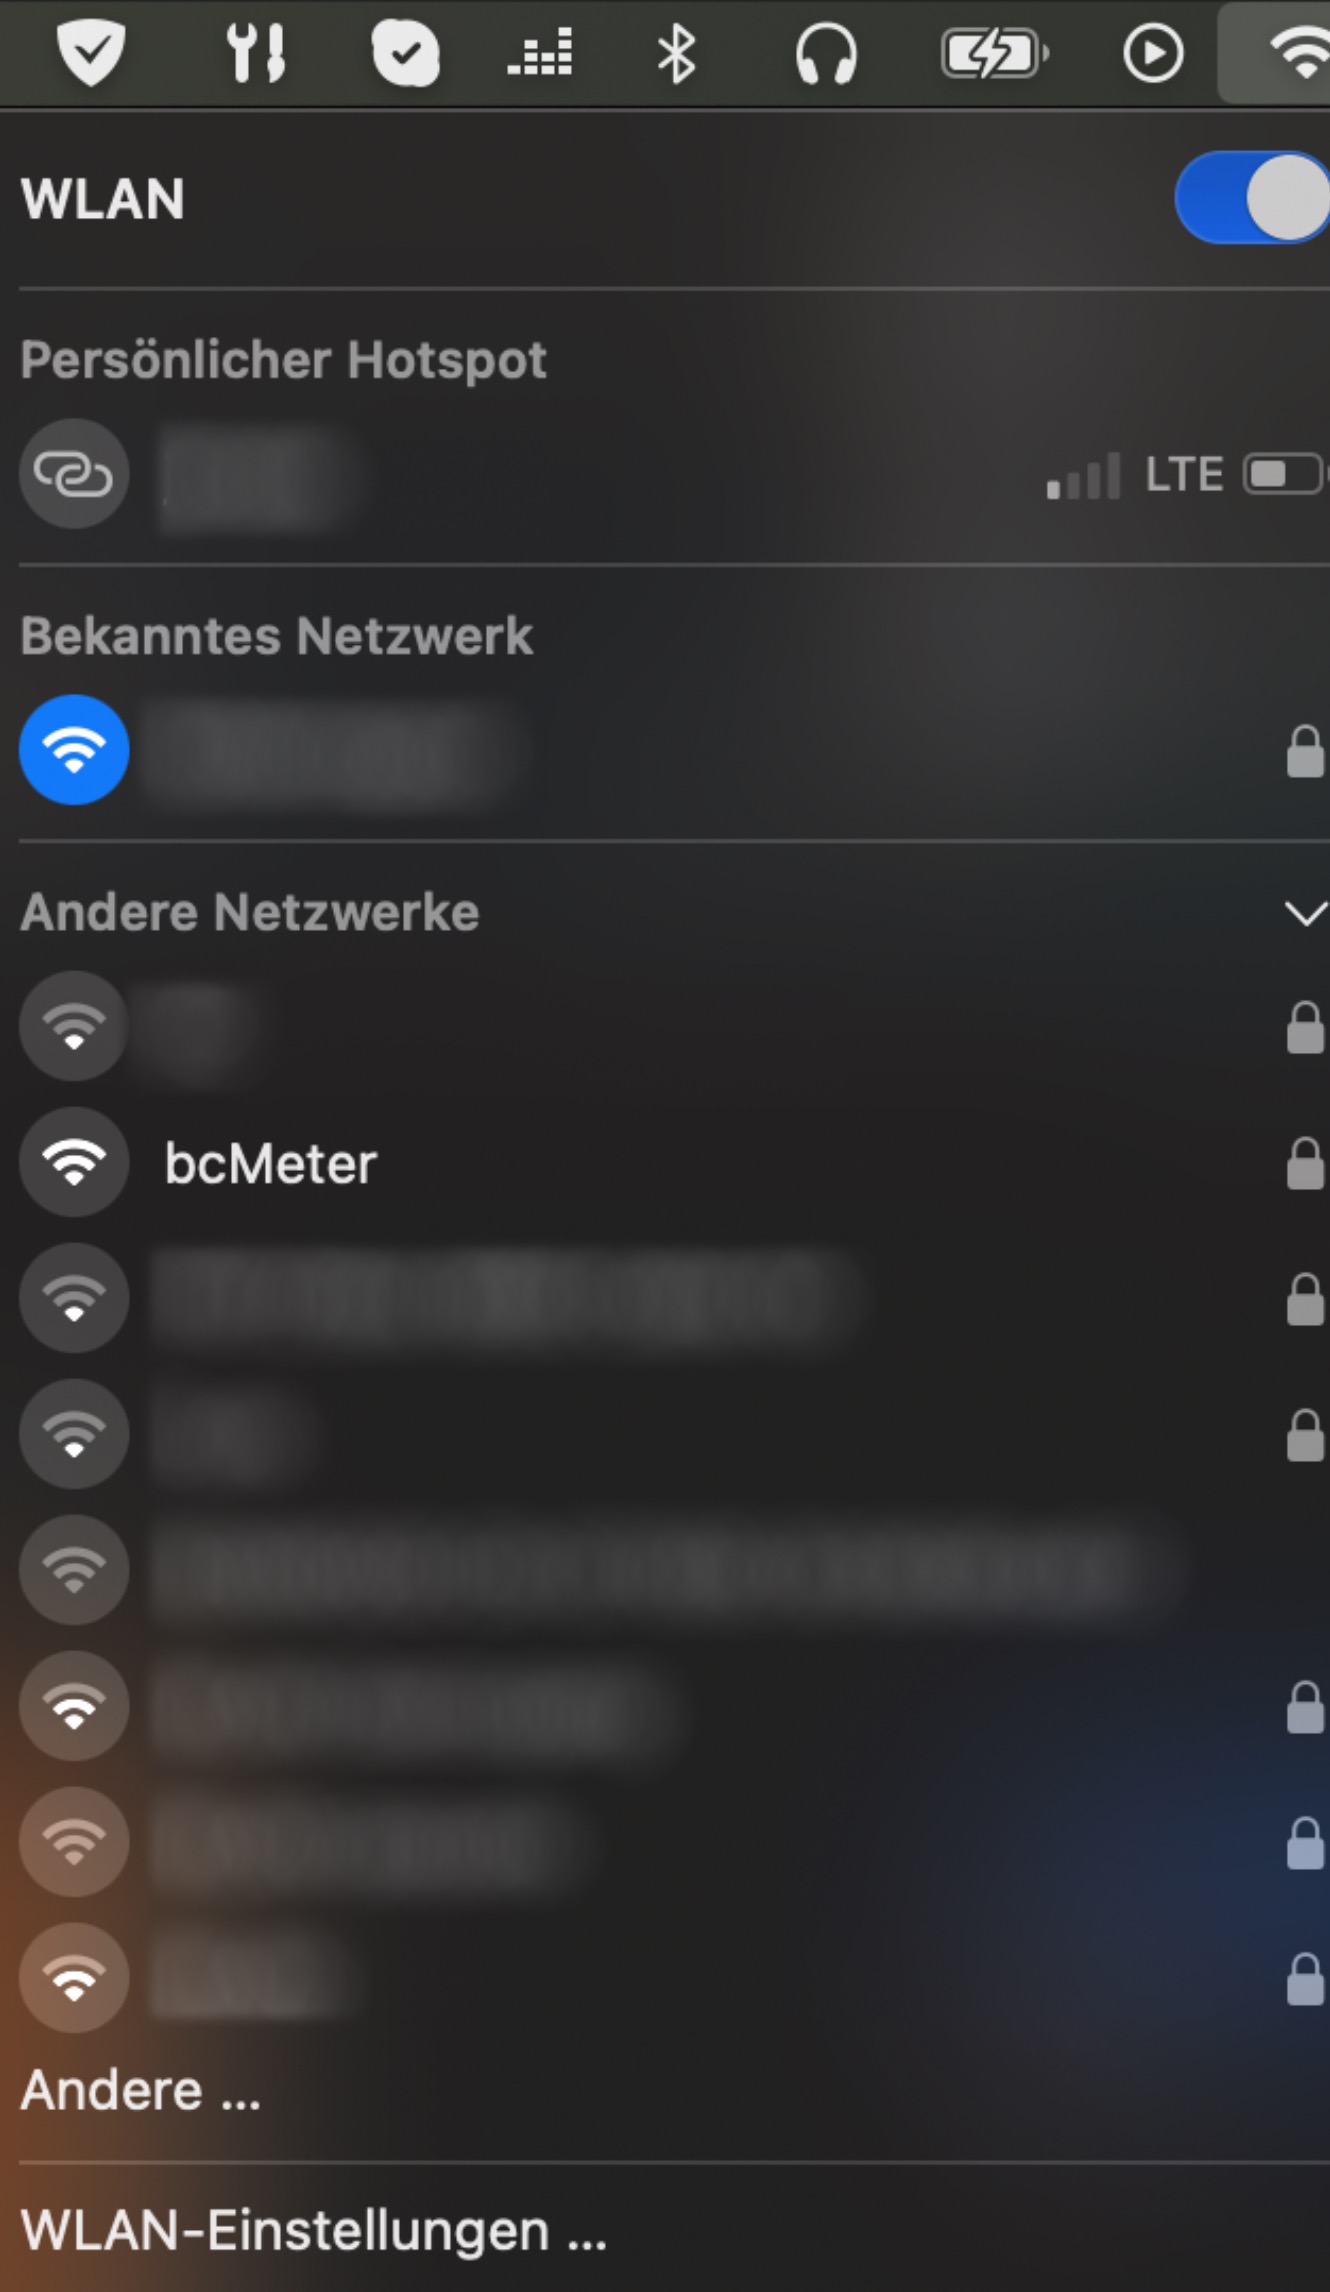 Figure 2.8: macOS submenu for unknown wireless networks in range
 - bcMeter tries to open its configuration interface directly within a few seconds. On a market unit, scan the WLAN QR or enter the individual device/AP password printed on its sticker. On a private unit, the hotspot is open and requires no password.
- Your computer may warn you that this network has "No Internet Connection." This is normal. Select "Keep Connected" if prompted. Do not choose "use mobile data".
- Open a browser and type
http://192.168.18.8into the address bar. The device will also open this page automatically. The Welcome screen appears on first use (see Section 2.5).
It can be related to a second, equally harmless effect: right after a cold start the device may report a brownout (insufficient power supply). This message is benign as well and is fixed as of firmware 1.5.360.
Blue Status LED
The physical blue LED on the device provides a quick hardware status indication:
| LED Pattern | Meaning |
|---|---|
| Steady dim light | The device has not fully or correctly started, or it has been shut down. |
| Slow pulse | The device is idle and ready. Pump is off. |
| Fast pulse | A measurement session is running. |
2.5 Welcome Screen
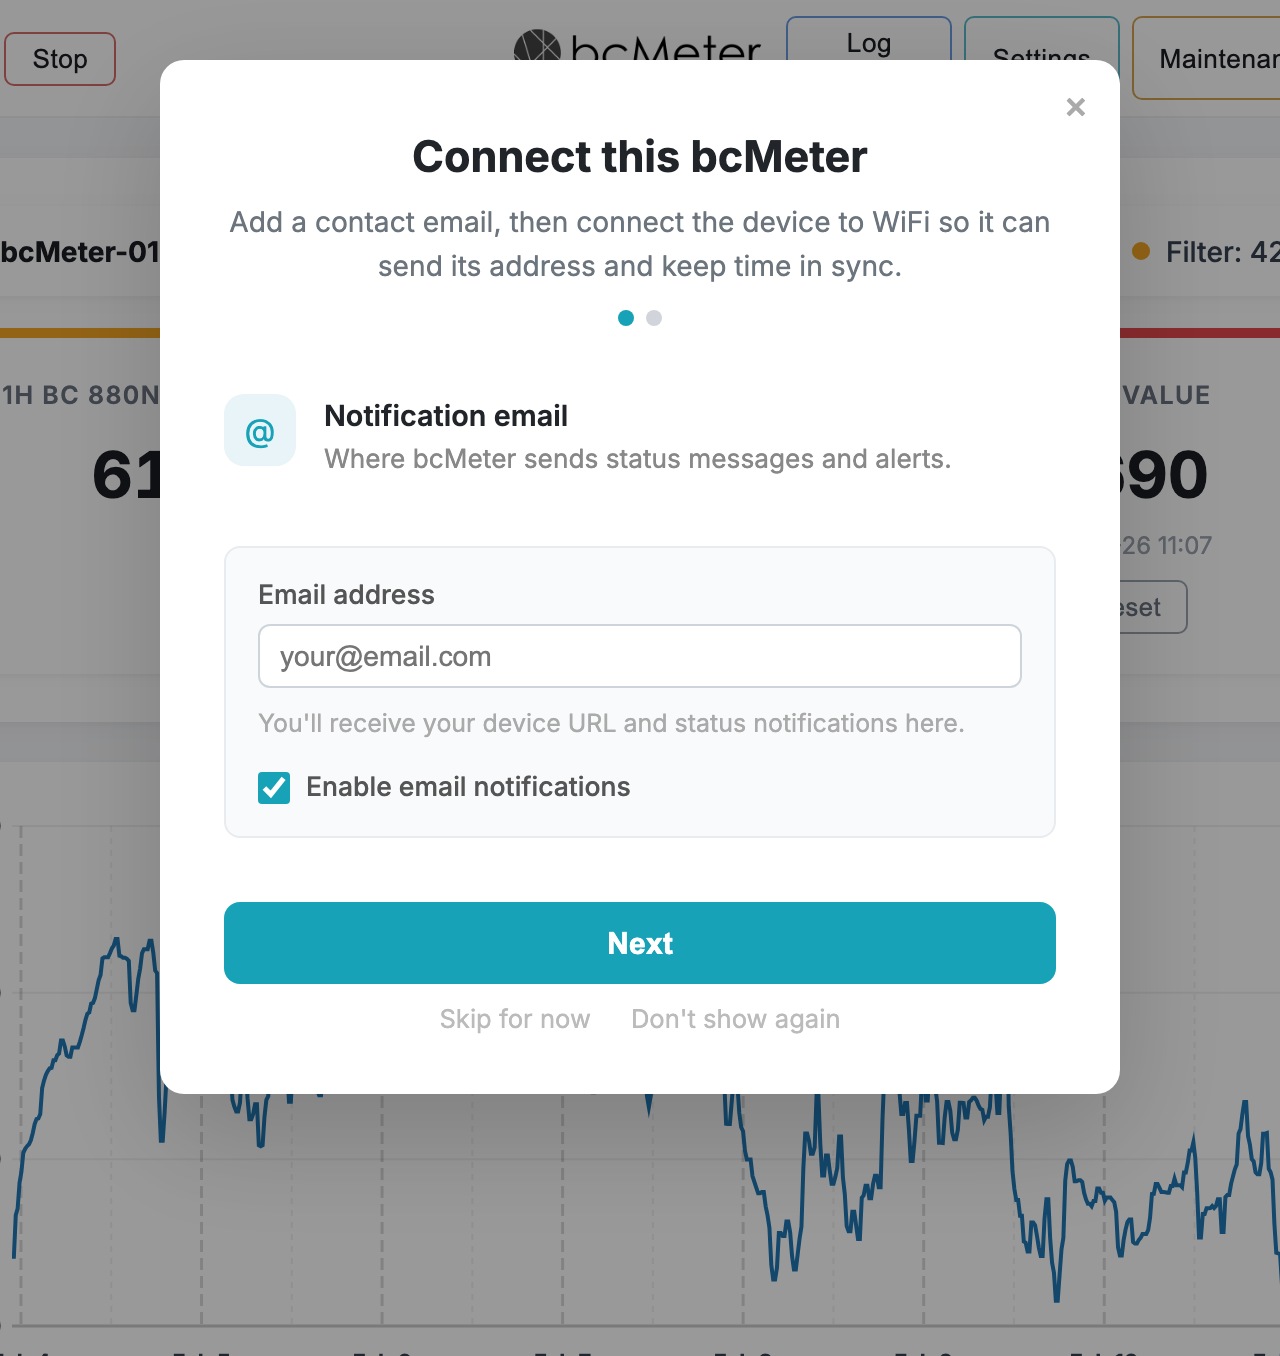
On first use, bcMeter shows a two-step welcome screen for email and network setup.
Step 1 - Notification email
Enter the email address where bcMeter should send status messages and alerts. After WiFi setup, the device can send its local access link and connection details to this address.
Step 2 - Connect to network
Select your WiFi network, enter the password, and click Connect. Use Scan to refresh the list, or Enter manually if the network is hidden. The device hostname (e.g. bcmeter-0110.local) is shown in the captive-portal note - bookmark it to access your device later on your local network.
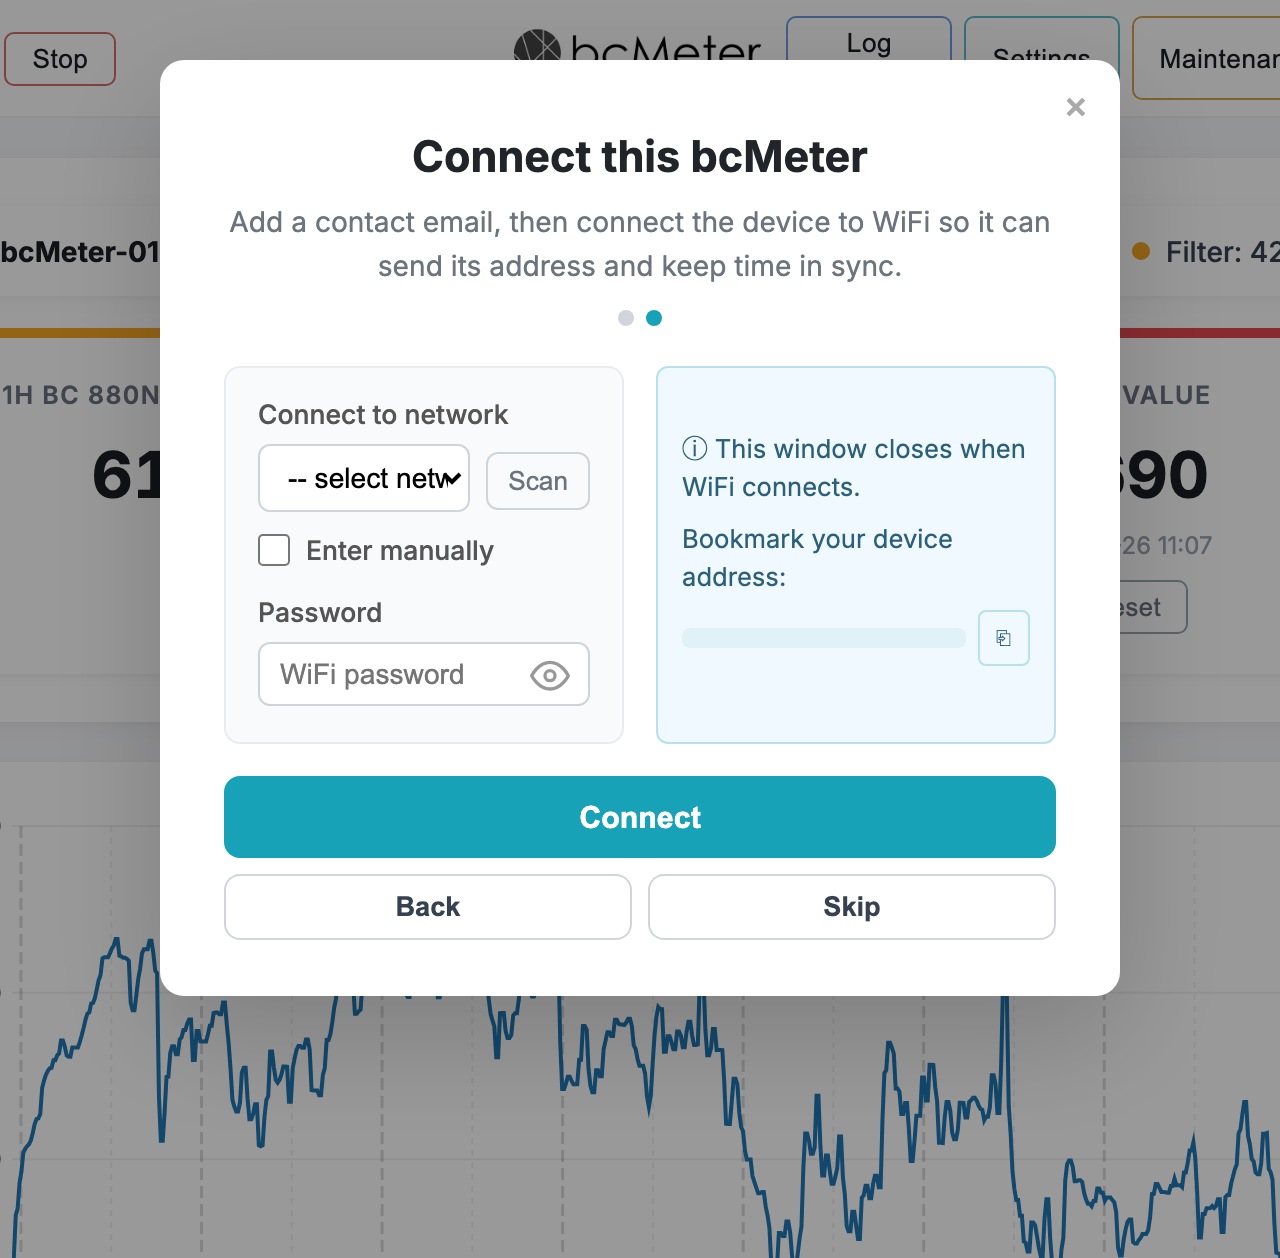
After connecting, the setup hotspot turns off and bcMeter joins your network. Check your email for the interface link. Also check spam folders. Devices with a modem can also use cellular connectivity for status, location lookup, or data delivery, depending on the installed hardware.
2.6 Accessing the Interface
When the device is on your network, open it by hostname. The default hostname follows the pattern bcmeter-XXXX. For example:
The exact hostname is shown on the device label and in the Welcome email. You can also rename the device in Settings > Device > Device Name.
.local addresses do not work (common on some Windows networks or older routers), you will need to find the device's IP address in your router's administration interface or connect by the IP from onboarding email received after initial configuration.
3. Web Interface Overview
3.1 Dashboard Elements
Use the moon/sun button on the right side of the navigation bar to switch between light and dark mode. The browser remembers your preference for the next visit.
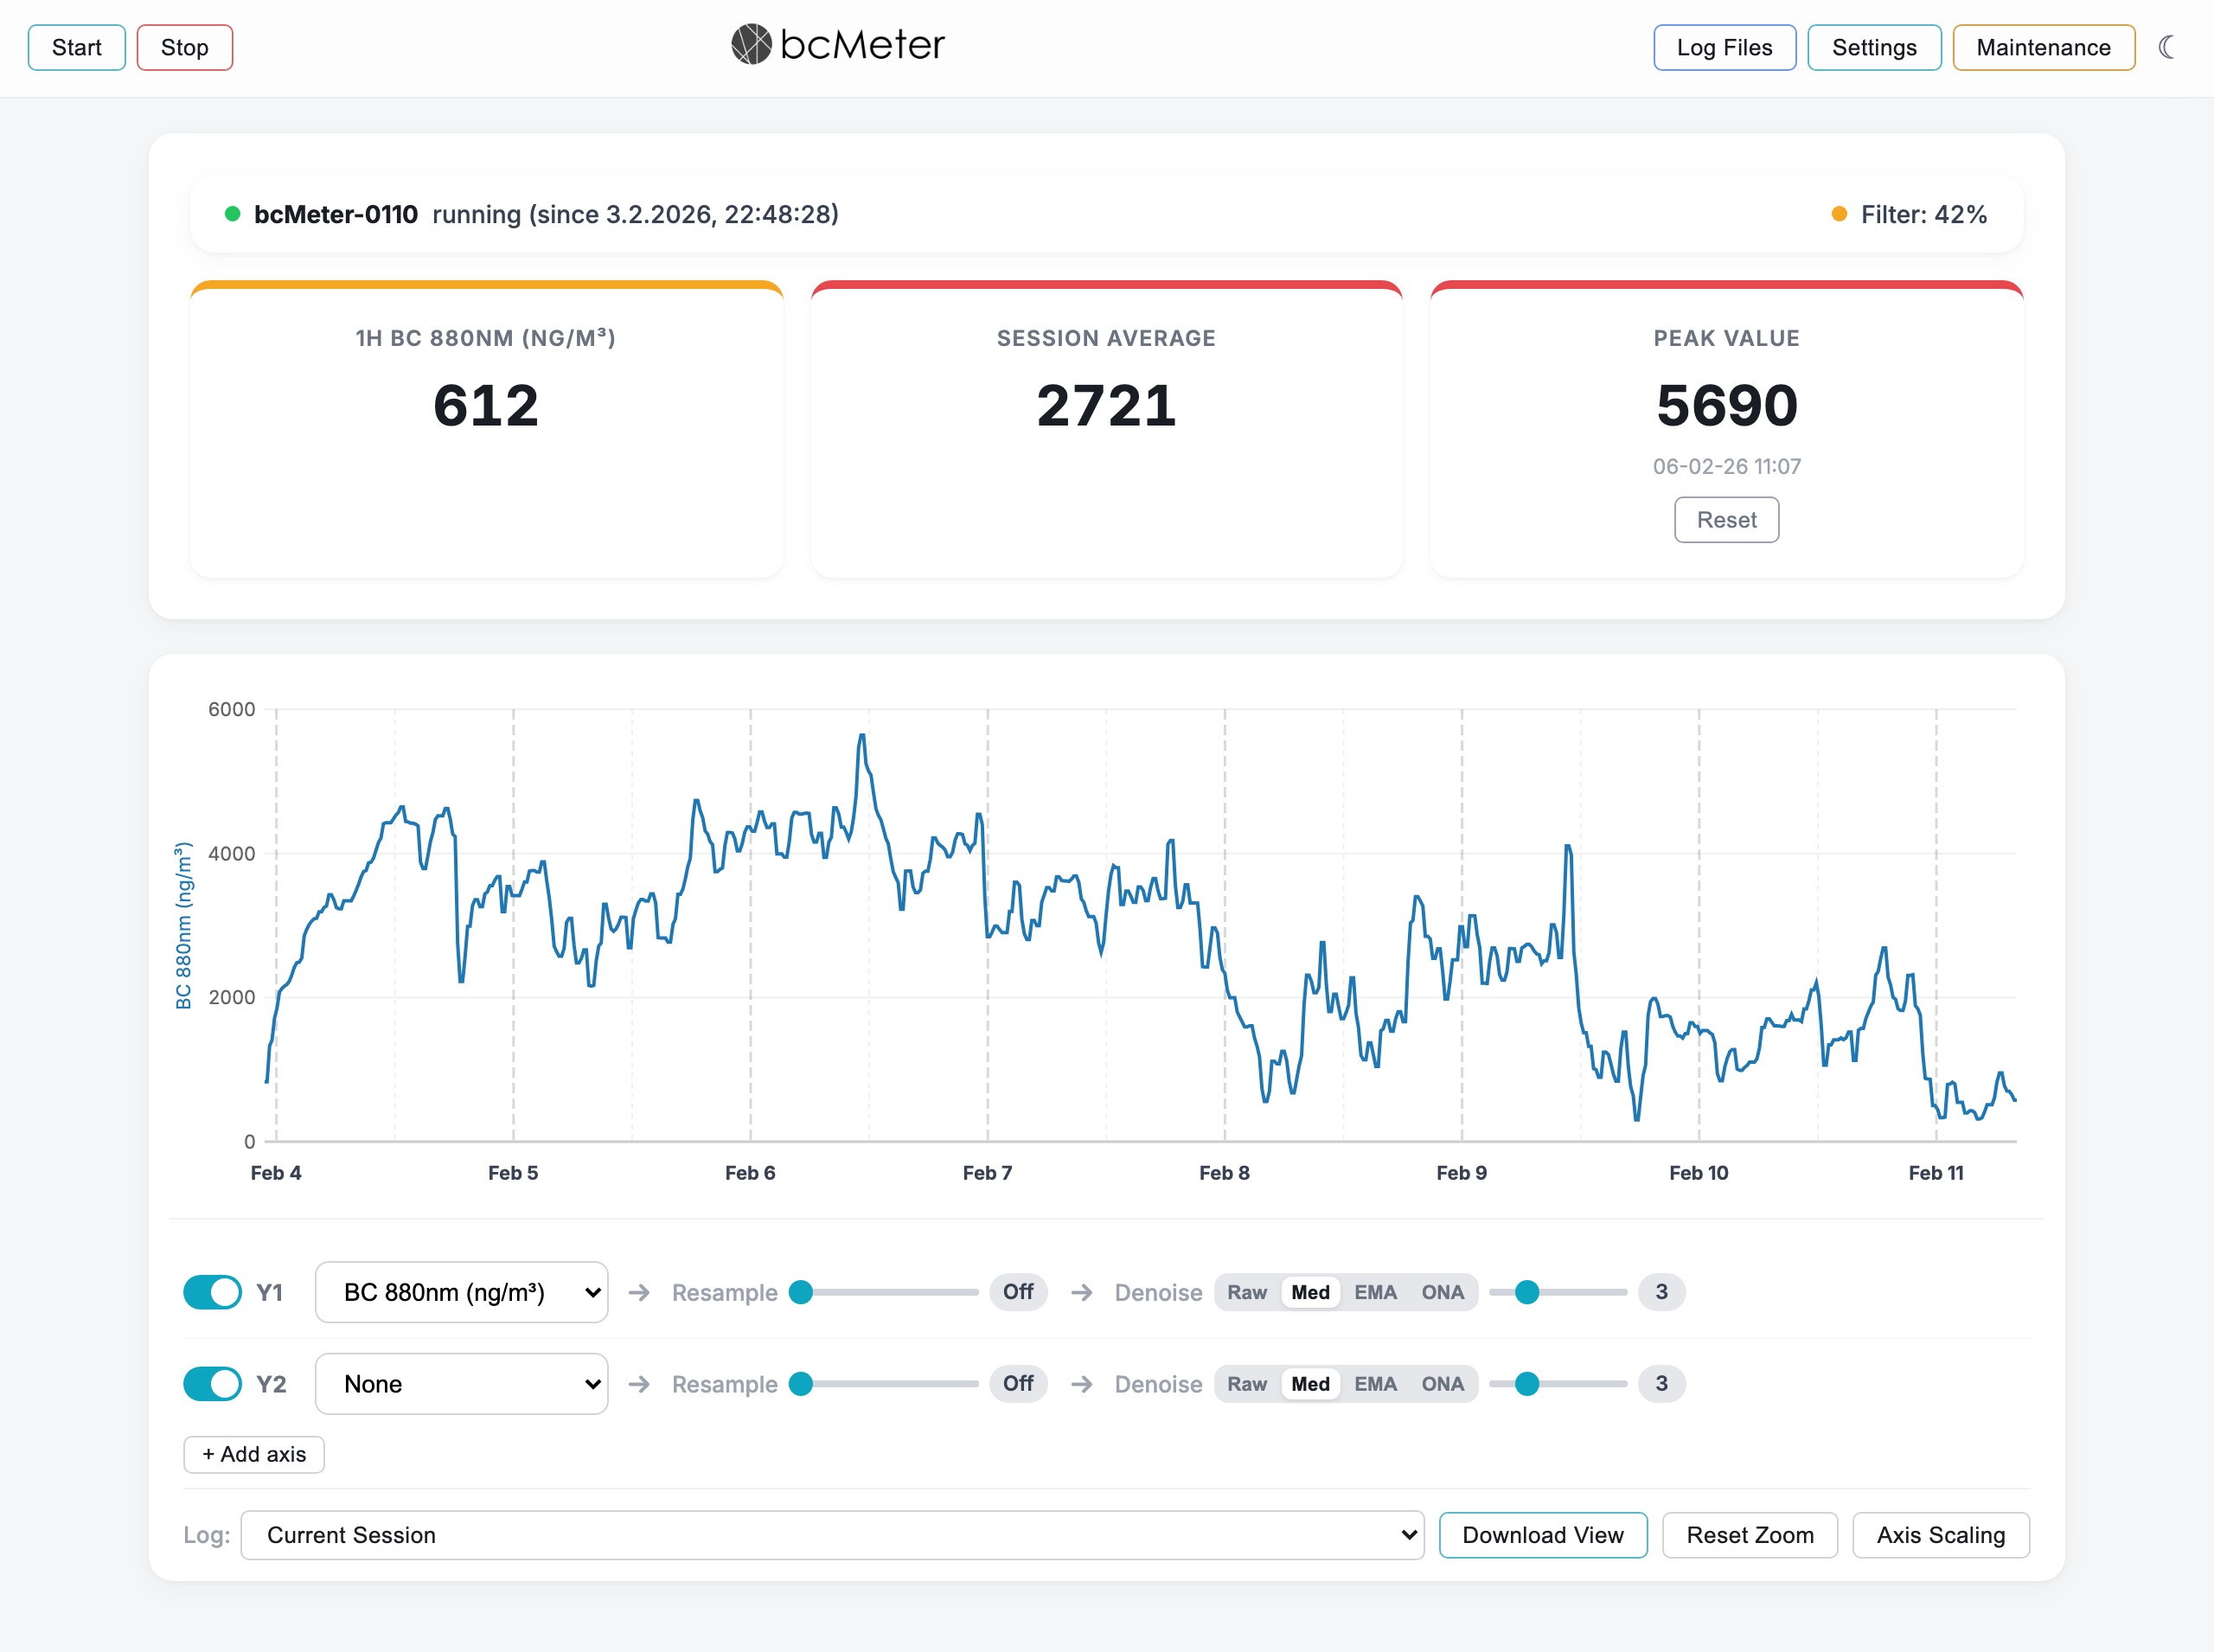
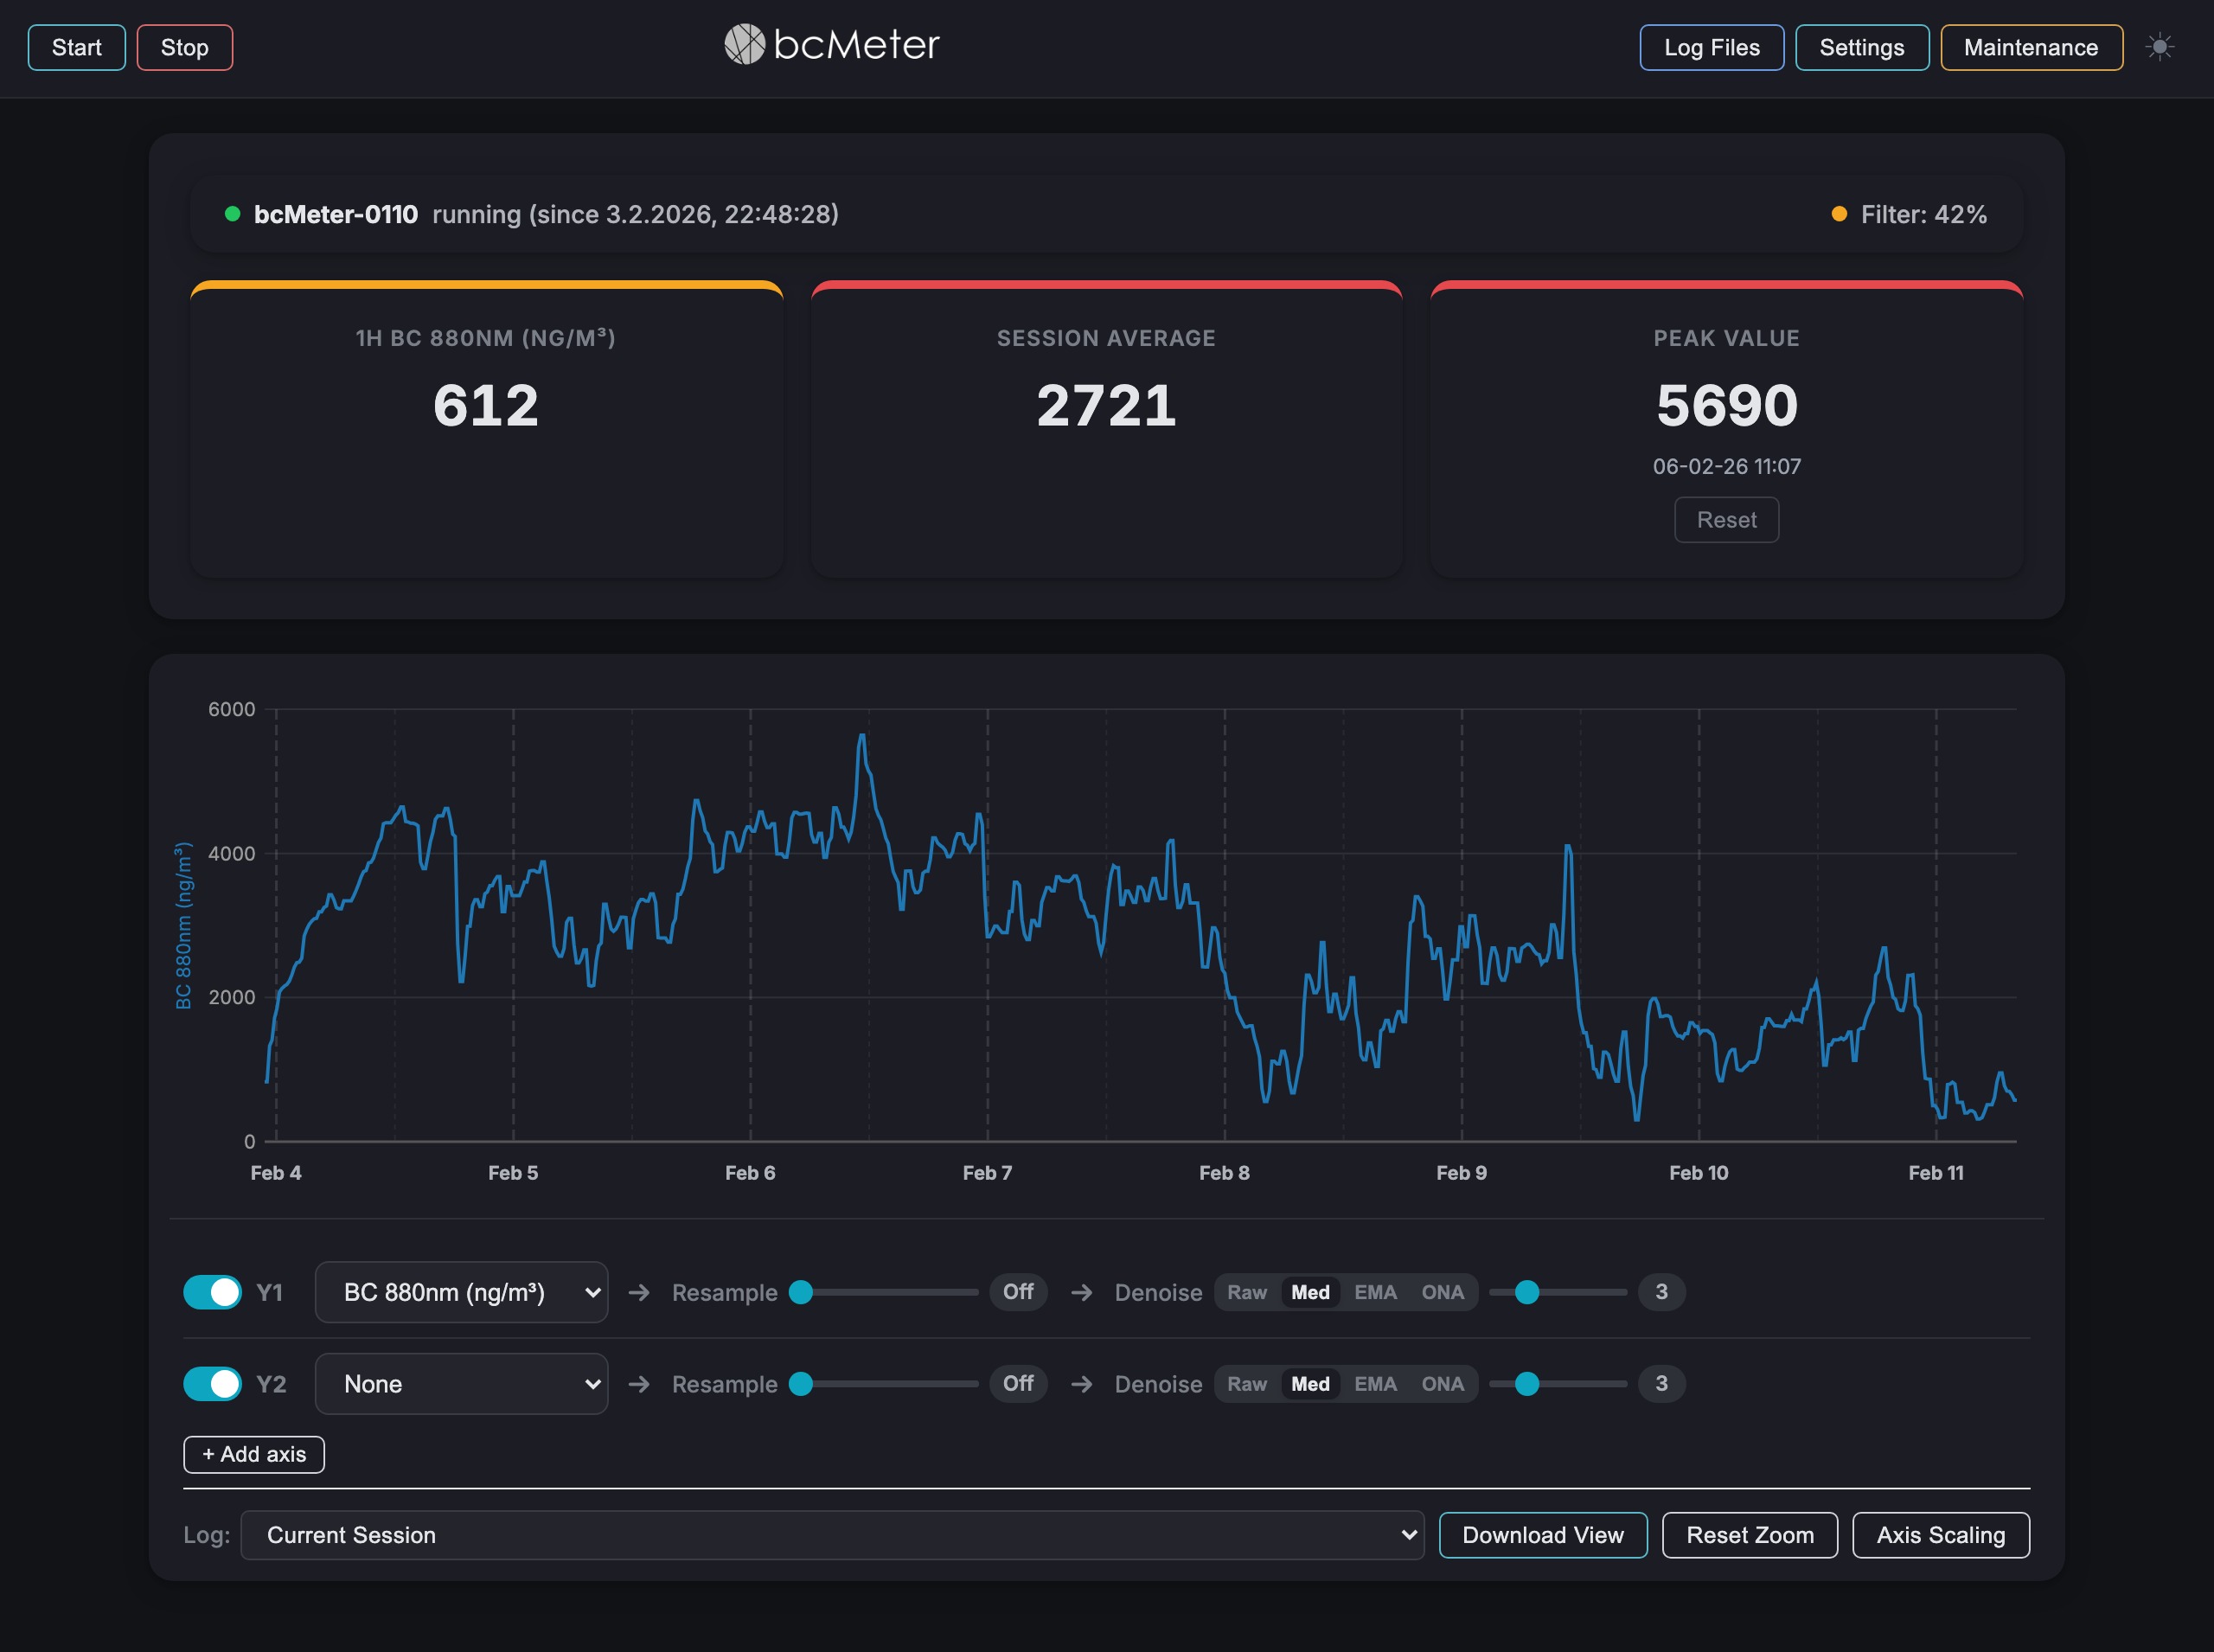
- Navigation Bar: Start and Stop buttons to control measurement sessions, quick access to Log Files, Settings, and Maintenance, and a dark-mode toggle on the far right.
- Status Panel: Device name, operating state, session start time, and filter loading with a color-coded indicator (see Section 3.2 for details).
- Statistics Cards: Rolling one-hour BC average, overall session average, and the peak concentration with its timestamp. Each value includes the selected measurement unit.
- Live Chart: Interactive time-series graph that updates as new samples arrive (see Section 3.3 for zoom and interaction).
- Chart Controls: Y-axis parameter assignment, smoothing and resampling controls, log selection, download, and zoom management (see Section 3.3 for details).
3.2 Status Indicators
Device Status
| Status | Meaning |
|---|---|
| Ready | Device is idle. Pump is off. |
| Initializing | Pump is priming and the optical chamber is warming up. Data is not yet recorded. |
| Running | Active measurement. Data is being saved. |
| Error | System error detected. Warm-up progress remains visible while the error is shown. After correcting the cause, start a new measurement; the previous error and warning state is cleared for the new run. Open System Status or download logs in the Maintenance menu for details. |
Time Sync Status
Normally, time syncs automatically. If the device clock is not synced, it shows "Time: not synced" in red. Use Maintenance > Time Synchronization to sync the device clock with your browser.
Filter Loading Status
The "Filter" indicator shows how much of the filter strip is loaded. The color changes with loading level:
- Green (0-30%): Filter is clean. Signal quality is optimal.
- Orange (30-70%): Loading is increasing. Mathematical compensation is active and effective. Prepare a replacement filter.
- Red (70-85%): Filter is heavily loaded. Compensation becomes less reliable. Replace filter soon. An email alert is sent every 12 hours when loading exceeds 70%.
- Dark (85%+): Filter is near saturation. Replace immediately for reliable measurements.
3.3 Data Visualization

Plot Behavior
The interactive chart renders time-series data as it arrives from the device. Because the underlying optical signal is analog, the trace will appear jagged and noisy - this is normal. Smoothed values (Median, EMA) are typically closer to the true concentration. After starting a session the chart remains empty until 3-4 samples have been collected; at the default 5-minute sample interval this means the first data point appears after roughly 15-20 minutes.
The access profile is fixed when the firmware is built. Market units use the individual device/AP password printed on the sticker; private units have an open hotspot and no device password. On market units, the password is required for credential and security changes, unsigned manual or service firmware uploads, and raw security diagnostics. The dashboard and ordinary measurement controls do not request it again. Stored credentials are never displayed.
Click and drag horizontally on the chart to zoom into a time window. Double-click anywhere on the chart to reset the zoom back to the full session view.
Action Bar
The controls below the chart include:
- Log selector: A dropdown on the left lets you switch between the current live session and any previously recorded log file stored on the device. Selecting an older log replaces the chart data instantly.
- Download View: Exports the currently visible data - respecting any active zoom and filter settings - as CSV, PNG, or SVG.
- Reset Zoom: Restores the chart to the full time range after you have zoomed in.
- Axis Scaling: Opens a panel to manually set the Y-axis minimum and maximum. Useful when extreme peaks compress the rest of the data into a flat line.
Y-Axis Controls
Each axis row (Y1, Y2, and optional additional axes via + Add axis) contains:
- Enable toggle: A switch on the left to show or hide the axis.
- Parameter dropdown: Select which measurement to plot on this axis (see Section 3.4 for the full list of available parameters).
- Smoothing algorithm: A segmented control offering four modes:
- Raw - unfiltered signal, shows every fluctuation.
- Med (Median) - removes outlier spikes while preserving sharp transitions. Good general-purpose choice.
- EMA (Exponential Moving Average) - produces a smooth curve that follows trends but responds slower to sudden changes.
- ONA (Optimized Noise Average) - adaptive filter tuned for the optical noise profile of the sensor.
- Resample slider: Averages consecutive samples together to reduce noise and thin out the data. Setting it to 2x halves the number of points (each pair is averaged), 5x averages every five, and so on. Particularly useful for noisy data at high sample rates or long sessions where individual fluctuations obscure the underlying trend. "Off" (value 1) shows every original sample.
- Denoise slider: Controls the strength of the selected smoothing algorithm. Low values (1-3) preserve faster changes; higher values (5+) produce a cleaner ambient-air trend.
3.4 Plot Parameters
These parameters can be assigned to Y1, Y2, or added axes:
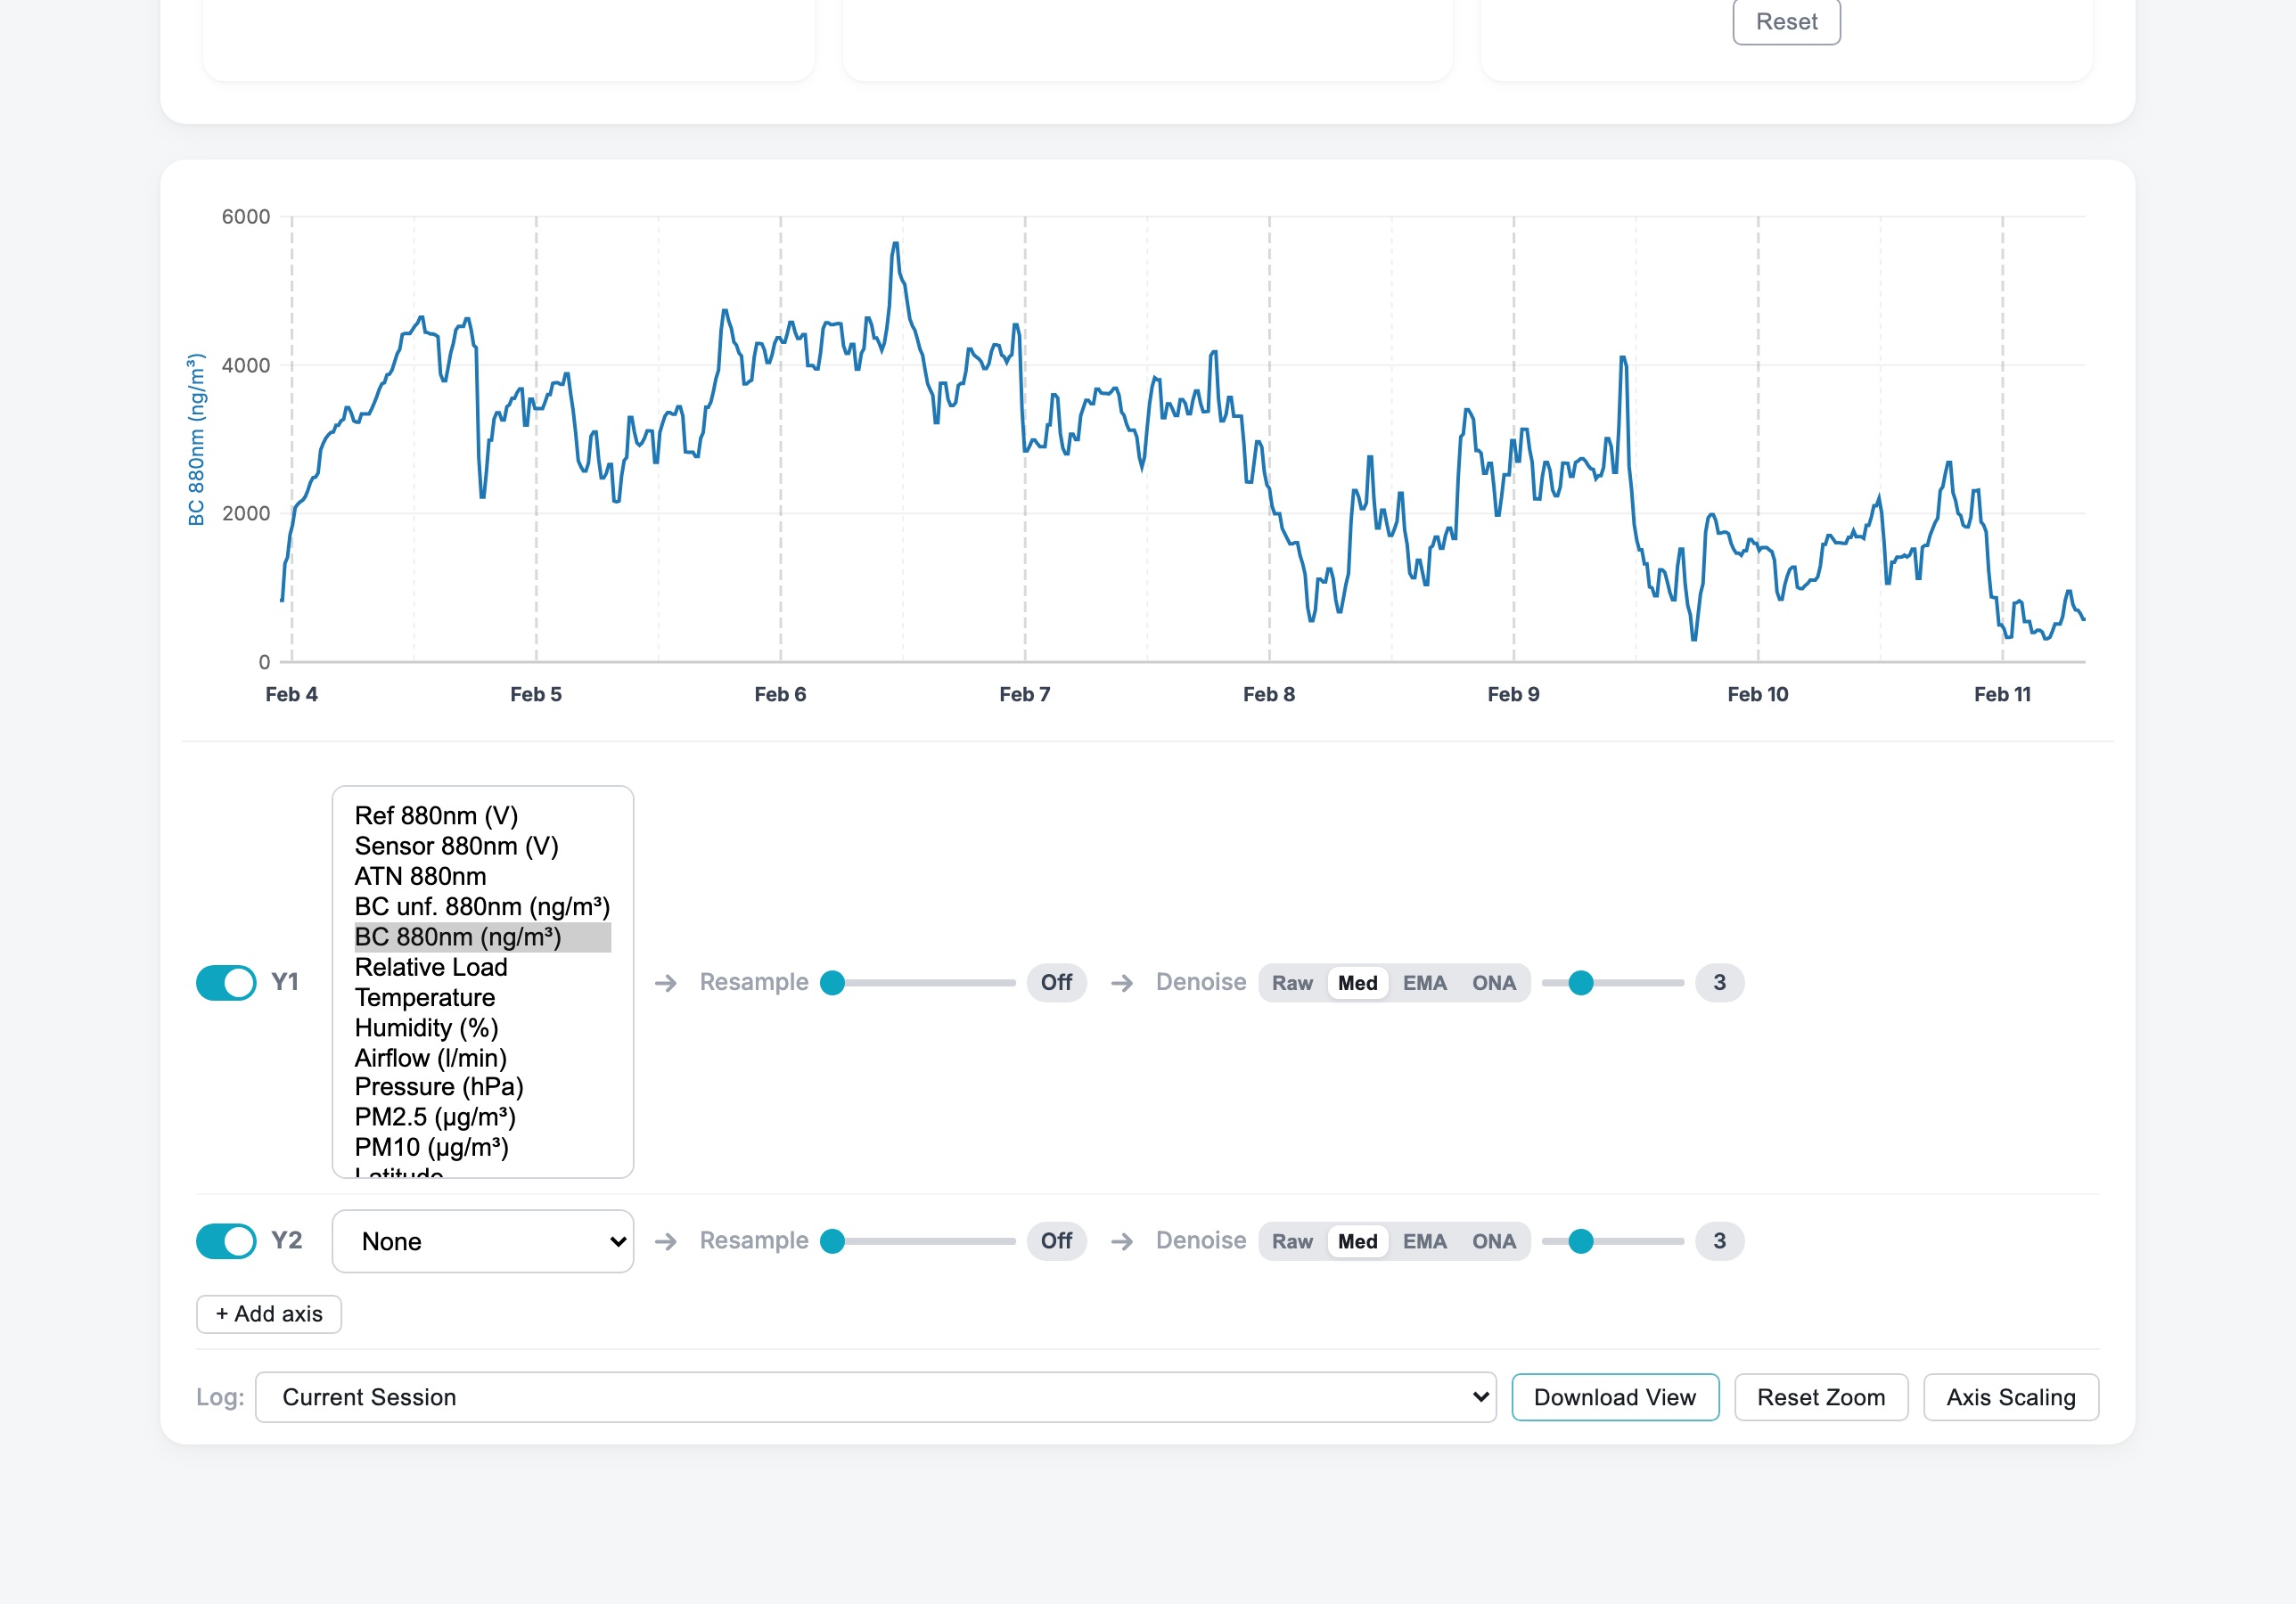
| Reference (880nm) | Light intensity from the 880nm LED passing through an unused, clean portion of the filter - serves as baseline for comparison. Optional wavelengths: 520nm, 370nm (if multi-wavelength hardware is installed). |
| Sensor (880nm) | Light intensity from the 880nm LED after passing through the particle-loaded spot on the filter. |
| Attenuation (880nm) | Calculated reduction in light intensity caused by light-absorbing particles collected on the filter. |
| BC Unfiltered (880nm) | Real-time, high-resolution black carbon concentration without smoothing or averaging filters. |
| Black Carbon (880nm) | Black carbon concentration in ng/m³, derived from the primary 880nm measurement wavelength. |
| Relative Load | Filter spot saturation level (percentage), indicating when filter replacement is needed. |
| Ångström Exponent | Ratio indicating aerosol source characteristics (requires multi-wavelength hardware). |
| Temperature (°C) | Internal operating temperature - important for measurement stability. |
| Humidity (%) | Relative humidity inside the device (if sensor equipped). |
| Air Flow (l/min) | Current airflow rate through the filter (if flow sensor equipped). |
| Air Pressure (hPa) | Atmospheric pressure from the onboard barometric sensor. Used for altitude estimation and pressure-corrected BC calculations. Optional - only available if a pressure sensor (BME280) is installed. |
| PM2.5 (µg/m³) | Fine particulate matter concentration (particles ≤ 2.5 µm). Optional - requires an SPS30 particulate matter sensor. |
| PM10 (µg/m³) | Coarse particulate matter concentration (particles ≤ 10 µm). Optional - requires an SPS30 particulate matter sensor. |
4. Configuration & Settings
4.1 Main Controls
- Start: Begins a measurement session. The device first runs a 20-30 second initialization phase to prime the pump and stabilize the optical chamber. Data points appear after the configured sample interval.
- Stop: Ends the session and saves the file.
- Log Files: Opens the file manager to download or delete session logs.
4.2 Device Parameters (Settings)
Click Settings to configure the device. Settings are organized into tabs: Network, Measurement, Device, and Email.
Temperature shutdown: The default safety threshold is 65 °C. In Developer settings, temperature_shutdown_c can be adjusted from 40 to 80 °C. Reaching the threshold is recorded as an overtemperature incident: the running session is closed cleanly and an incident email is sent to configured recipients.
Other developer settings are explained in the wiki on bcmeter.org.
Network Tab
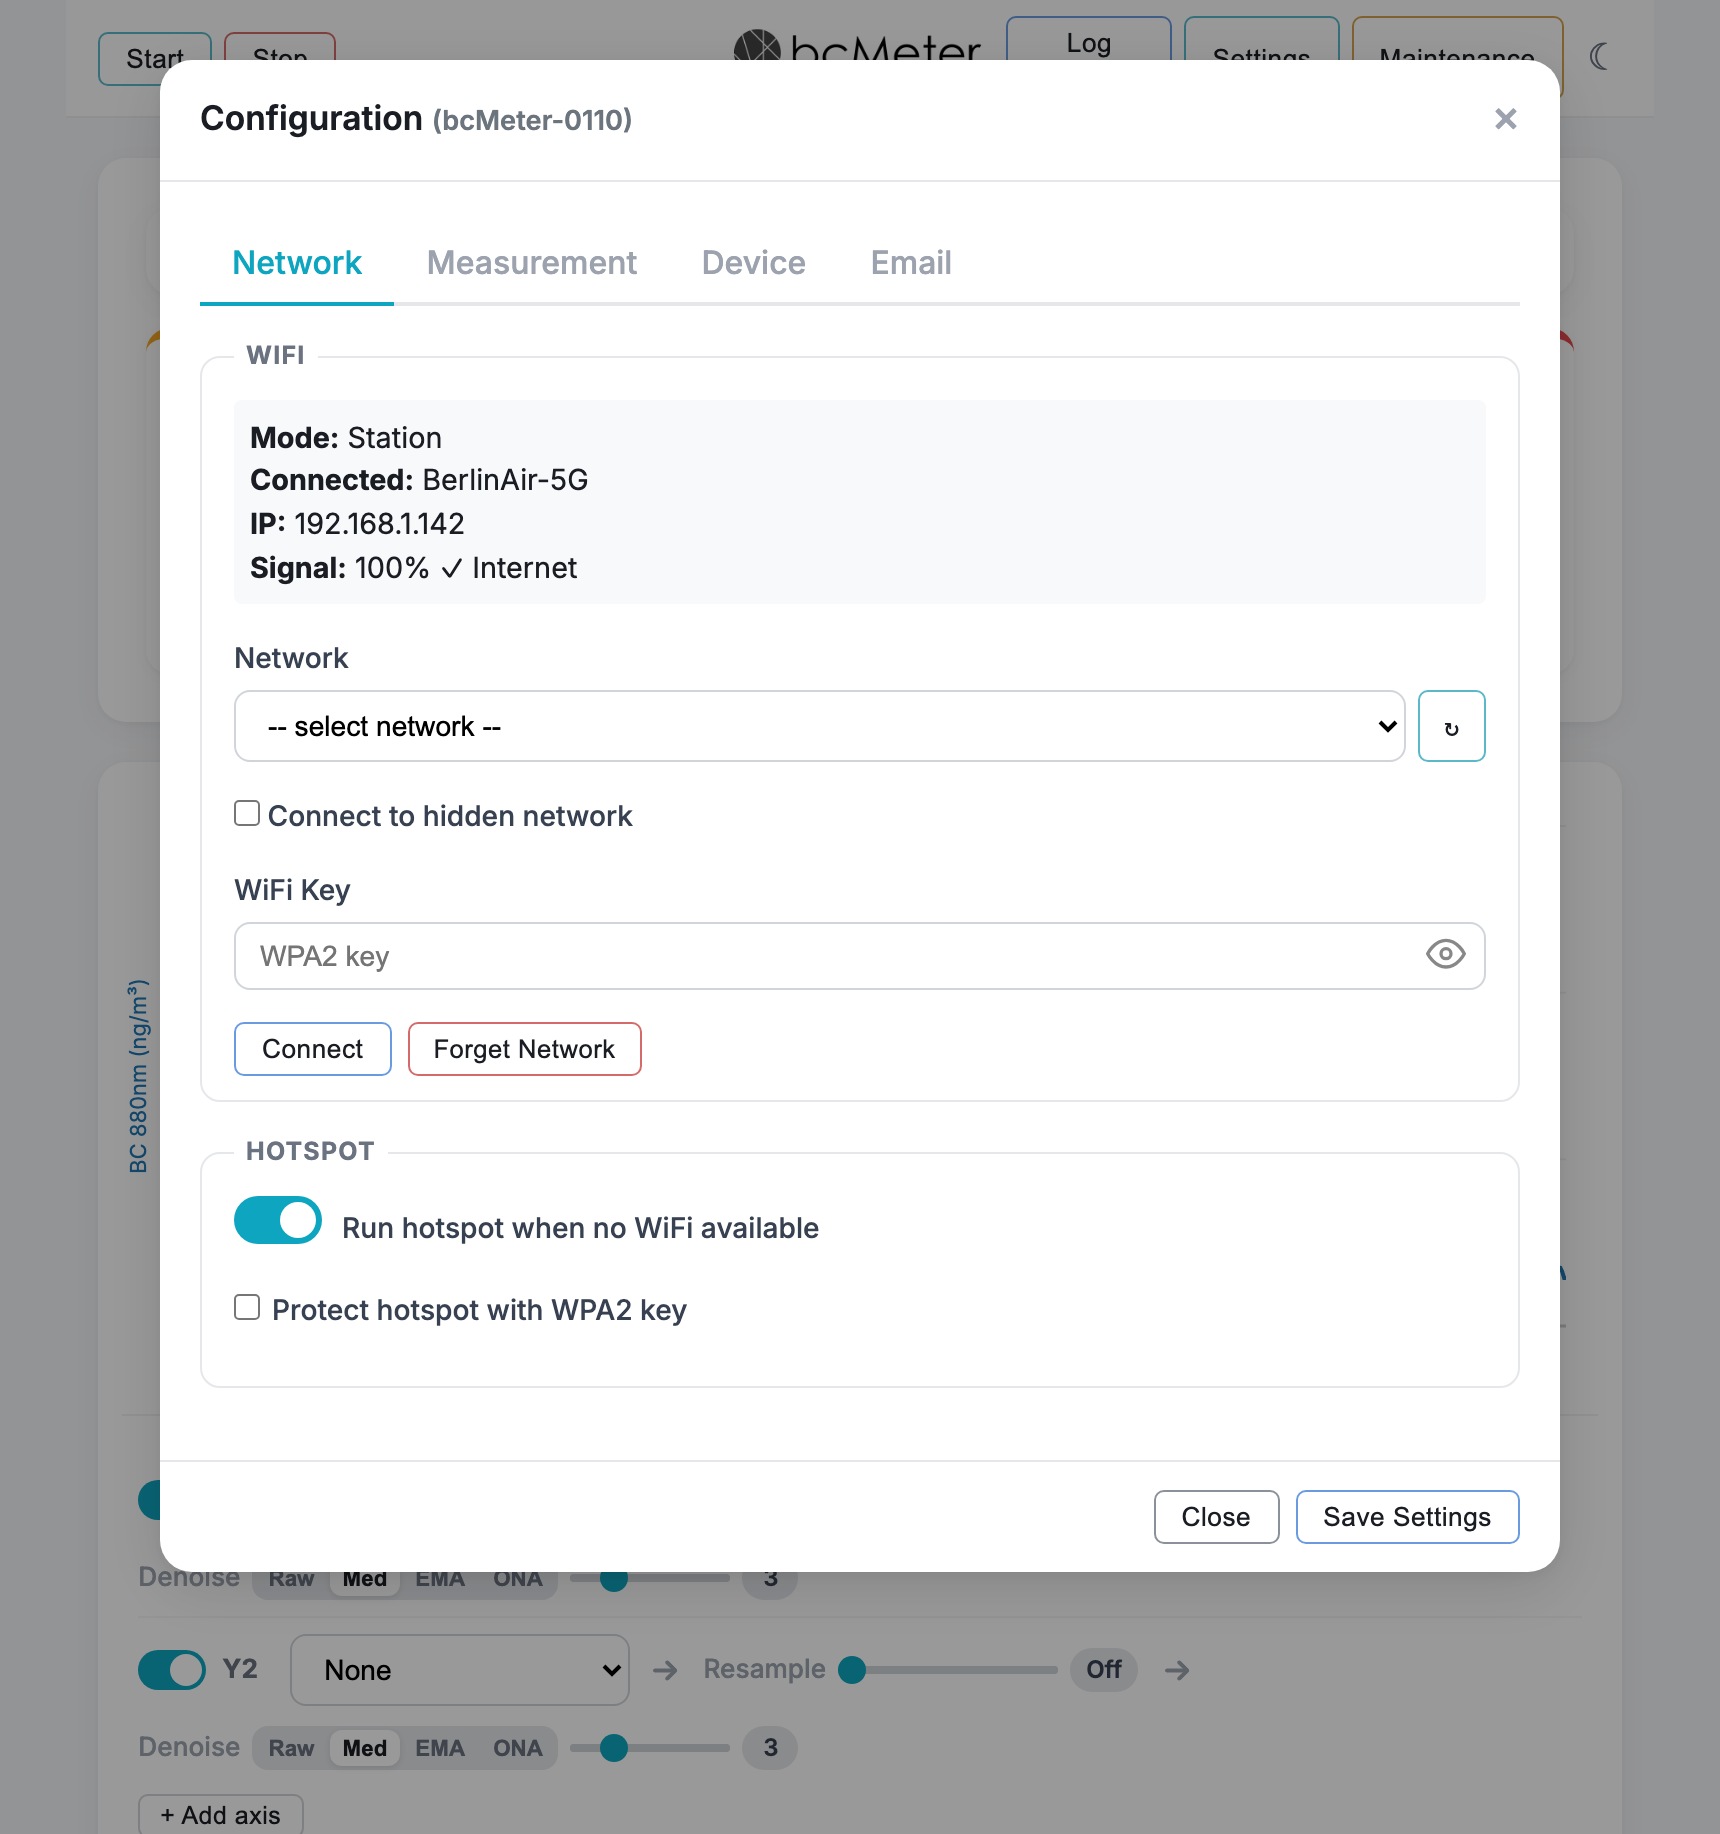
The Network tab manages wireless connectivity and is the default view when opening Settings.
| WiFi | Scan for available networks, select a network, and enter a password to connect the device to your existing WiFi. Use "Forget Network" to forget the stored network and switch back to hotspot mode. |
| Hotspot Mode | Forces the device to create its own WiFi network, even if a known network is available. |
| Protect hotspot with WPA2 key | When enabled, secures the bcMeter hotspot with a custom password instead of the default. Minimum 8 characters. |
Changing WiFi Later
If you skipped WiFi setup on the welcome screen, or need to change the network later, use the Network tab:
- Navigate to Settings > Network.
- Select your network from the dropdown. If your network is hidden, choose Enter manually and type the name yourself.
- Enter your WiFi key and click Connect.
- The setup hotspot disconnects while the device joins the selected network. Reconnect your computer to your normal WiFi.
- Wait 1-2 minutes for the device to join your network.
The Network tab also lets you configure the device hotspot. Enable Run hotspot when no WiFi available so the device creates its own access point as a fallback. You can optionally protect the hotspot with a WPA2 key.
Click Forget Network to disconnect from your stored network and force the device to create its hotspot again.
Measurement Tab
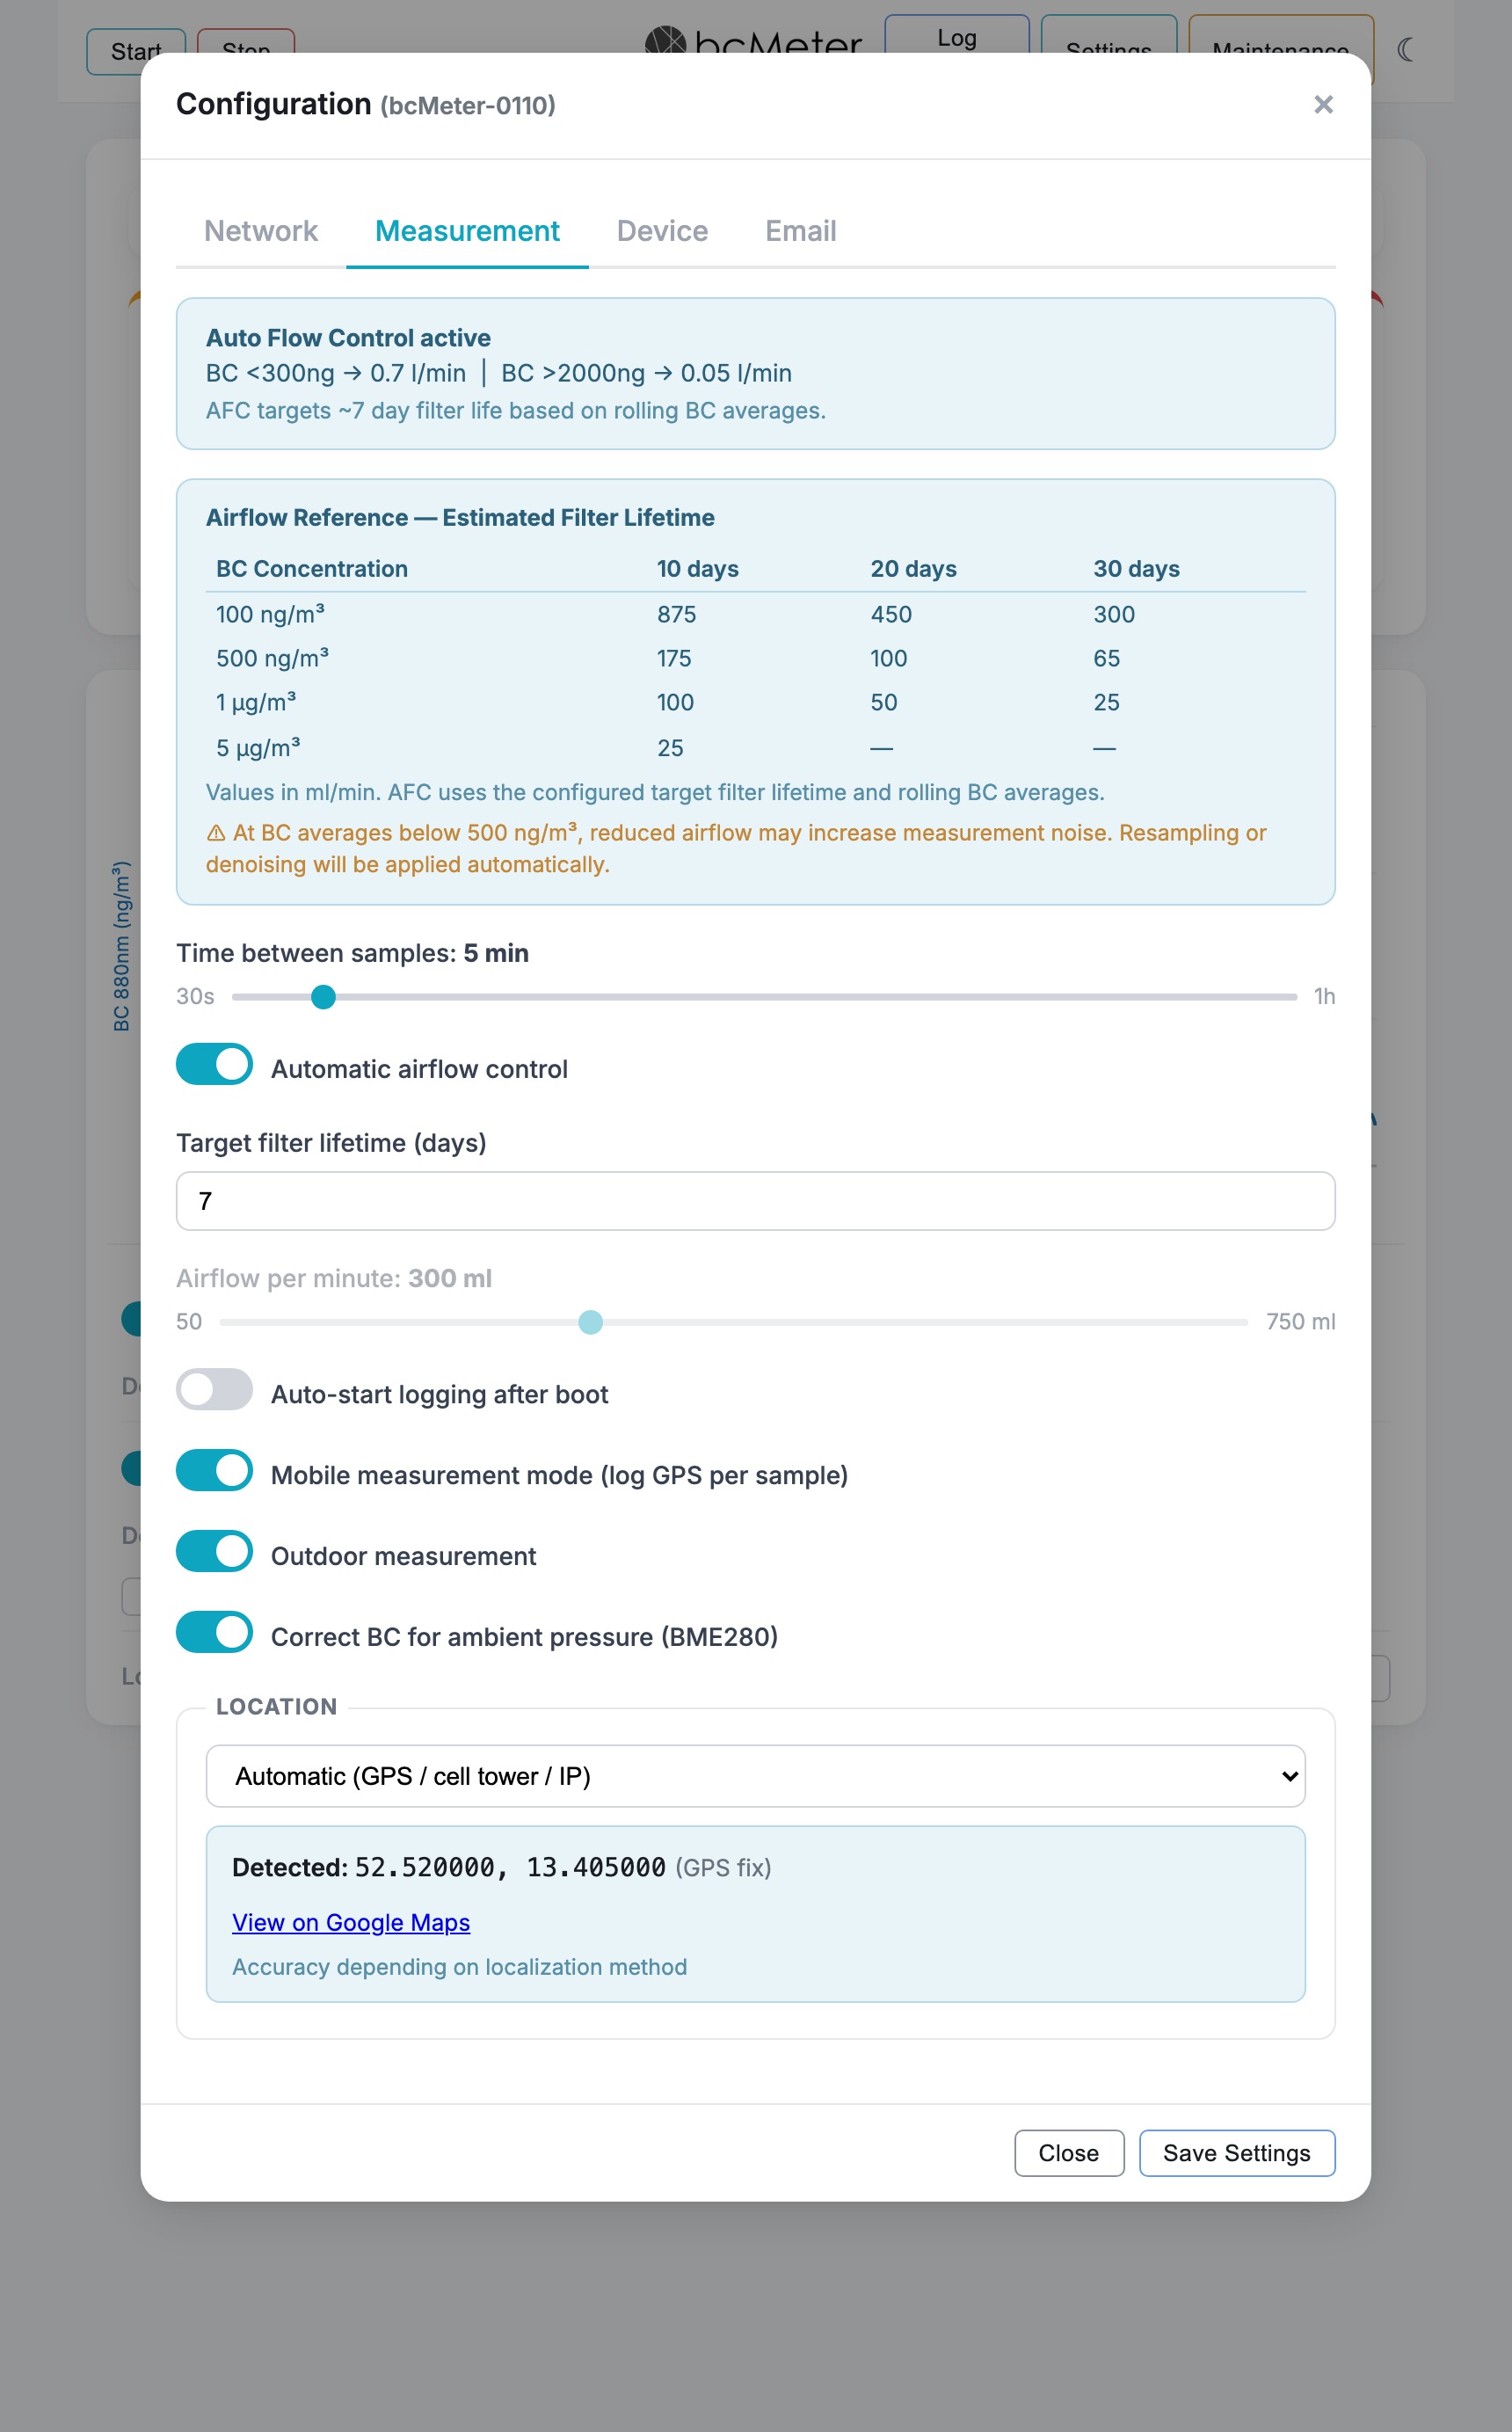
These settings define the sampling interval, airflow, location handling, and related measurement behavior. When Auto Flow Control (AFC) is active, a banner shows the current AFC limits.
| Time between samples | Default: 300s (5 min). Adjustable via slider from 30s to 1 hour. For ambient monitoring, 180-600s is recommended. Shorter intervals can increase noise. |
| Airflow per minute | Default: 300 ml/min. Adjustable via slider from 50 to 750 ml/min. Higher flow improves signal but loads filter faster. • Daily average >2000 ng/m³: reduce airflow. • Daily average <500 ng/m³: increase airflow. • Typical urban (~500 ng/m³): 100-250 ml/min. Disabled when Auto Flow Control is active. |
| Auto-adjust airflow | Adjusts airflow from the measured BC concentration. High BC lowers the flow to protect the filter; low BC raises the flow for a stronger signal. The manual airflow slider is locked while AFC is active. |
| Target filter lifetime | Default: 7 days. Target service life for the filter. AFC uses this value when calculating the airflow setpoint. |
| Auto-start logging | Starts a measurement session after boot. Requires prior calibration. After a restart or firmware update during an active measurement, the device continues the same log file and skips repeated optical warm-up; the normal wait for the next measurement-grid time remains. See Shutdown Device in Section 4.3. |
| Mobile measurement mode | For moving measurements. Location data is written for each sample when location hardware or geolocation data is available. |
| Outdoor measurement | Marks the measurement as outdoor ambient monitoring. Disable it for indoor measurements. |
| Pressure correction | Applies ambient pressure correction when a BME280 pressure sensor is installed. |
| Location | Controls how geographic coordinates are recorded with measurement data:
• Automatic: Uses the best available source - GPS module (optional, ~5 m accuracy), cellular modem cell tower lookup (optional, requires 4G module, ~1 km accuracy), or IP-based geolocation (~10-50 km accuracy). • Manual: Enter latitude and longitude manually (paste from Google Maps). • Off: No location data is stored. |
An Airflow Reference table is displayed below the settings, showing estimated filter lifetime (in days) at different BC concentrations and airflow rates to help choose the right airflow.
Device Tab
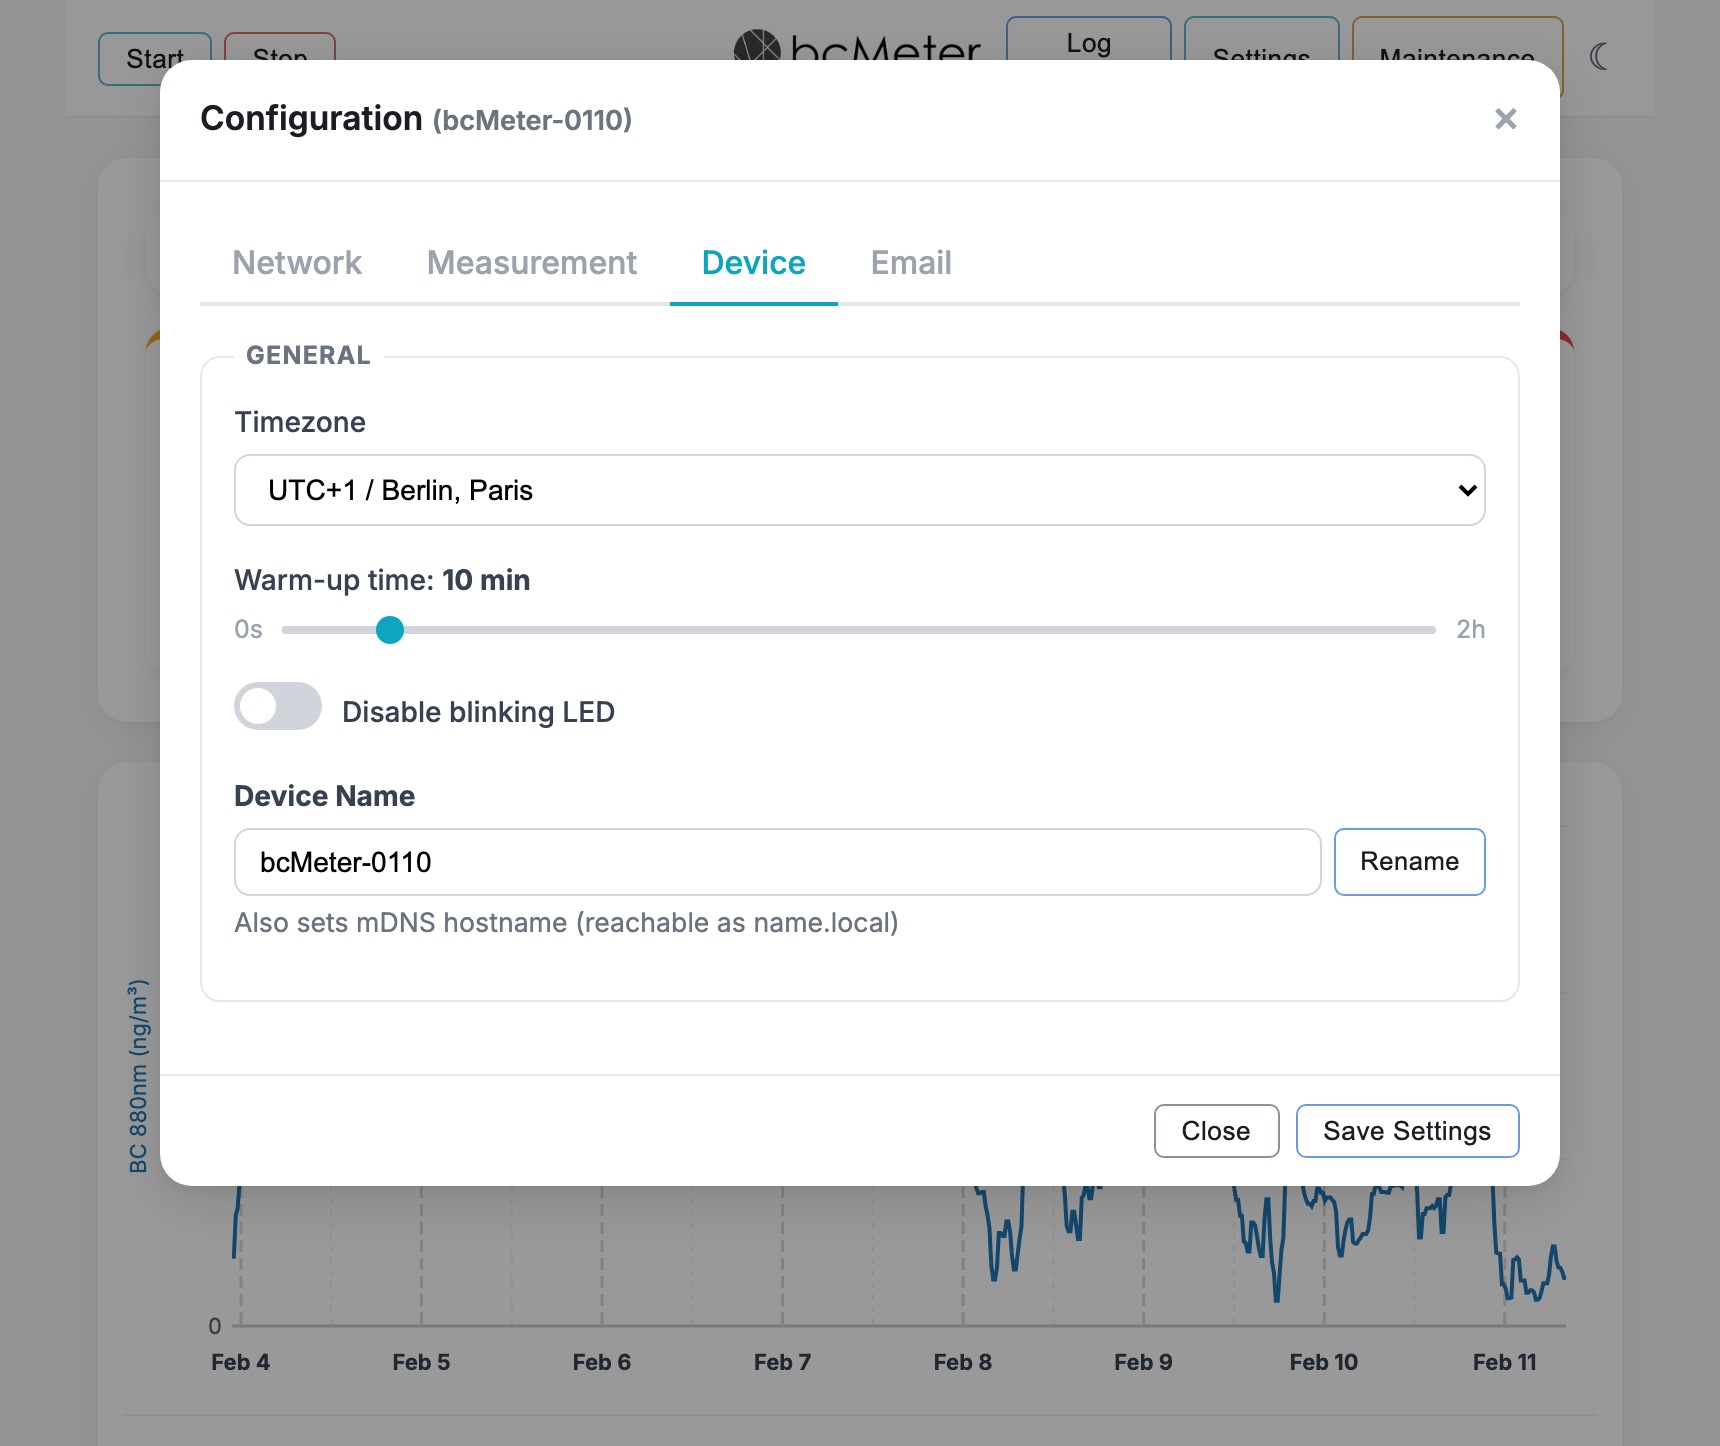
| Timezone | Select the device's timezone for accurate timestamps in log files. |
| Warm-up time | Default: 10 min. Adjustable via slider from 0 to 2 hours. Duration for the optical chamber to stabilize before measurement data is recorded. Set to 0 to disable warm-up. |
| Disable blinking LED | Deactivates the status LED on the device. |
| Modbus TCP server | Provides the live readings (BC, attenuation, airflow, temperature, humidity, pressure, particulate matter, device status) as read-only Modbus TCP registers on port 502, for direct integration into building management and SCADA systems. Off by default. The device documents its full register map at http://<device>/api/modbus. |
| Device Name | Network hostname (e.g., bcmeter201). Also sets the mDNS name, so the device becomes reachable as name.local after renaming and rebooting. |
Email Tab (Notifications)
Use this tab for email delivery of log files, filter status alerts, and optional data sharing with the bcMeter project. bcMeter Complete units already include the required mail service setup. bcMeter Kit details are in the bcMeter wiki.
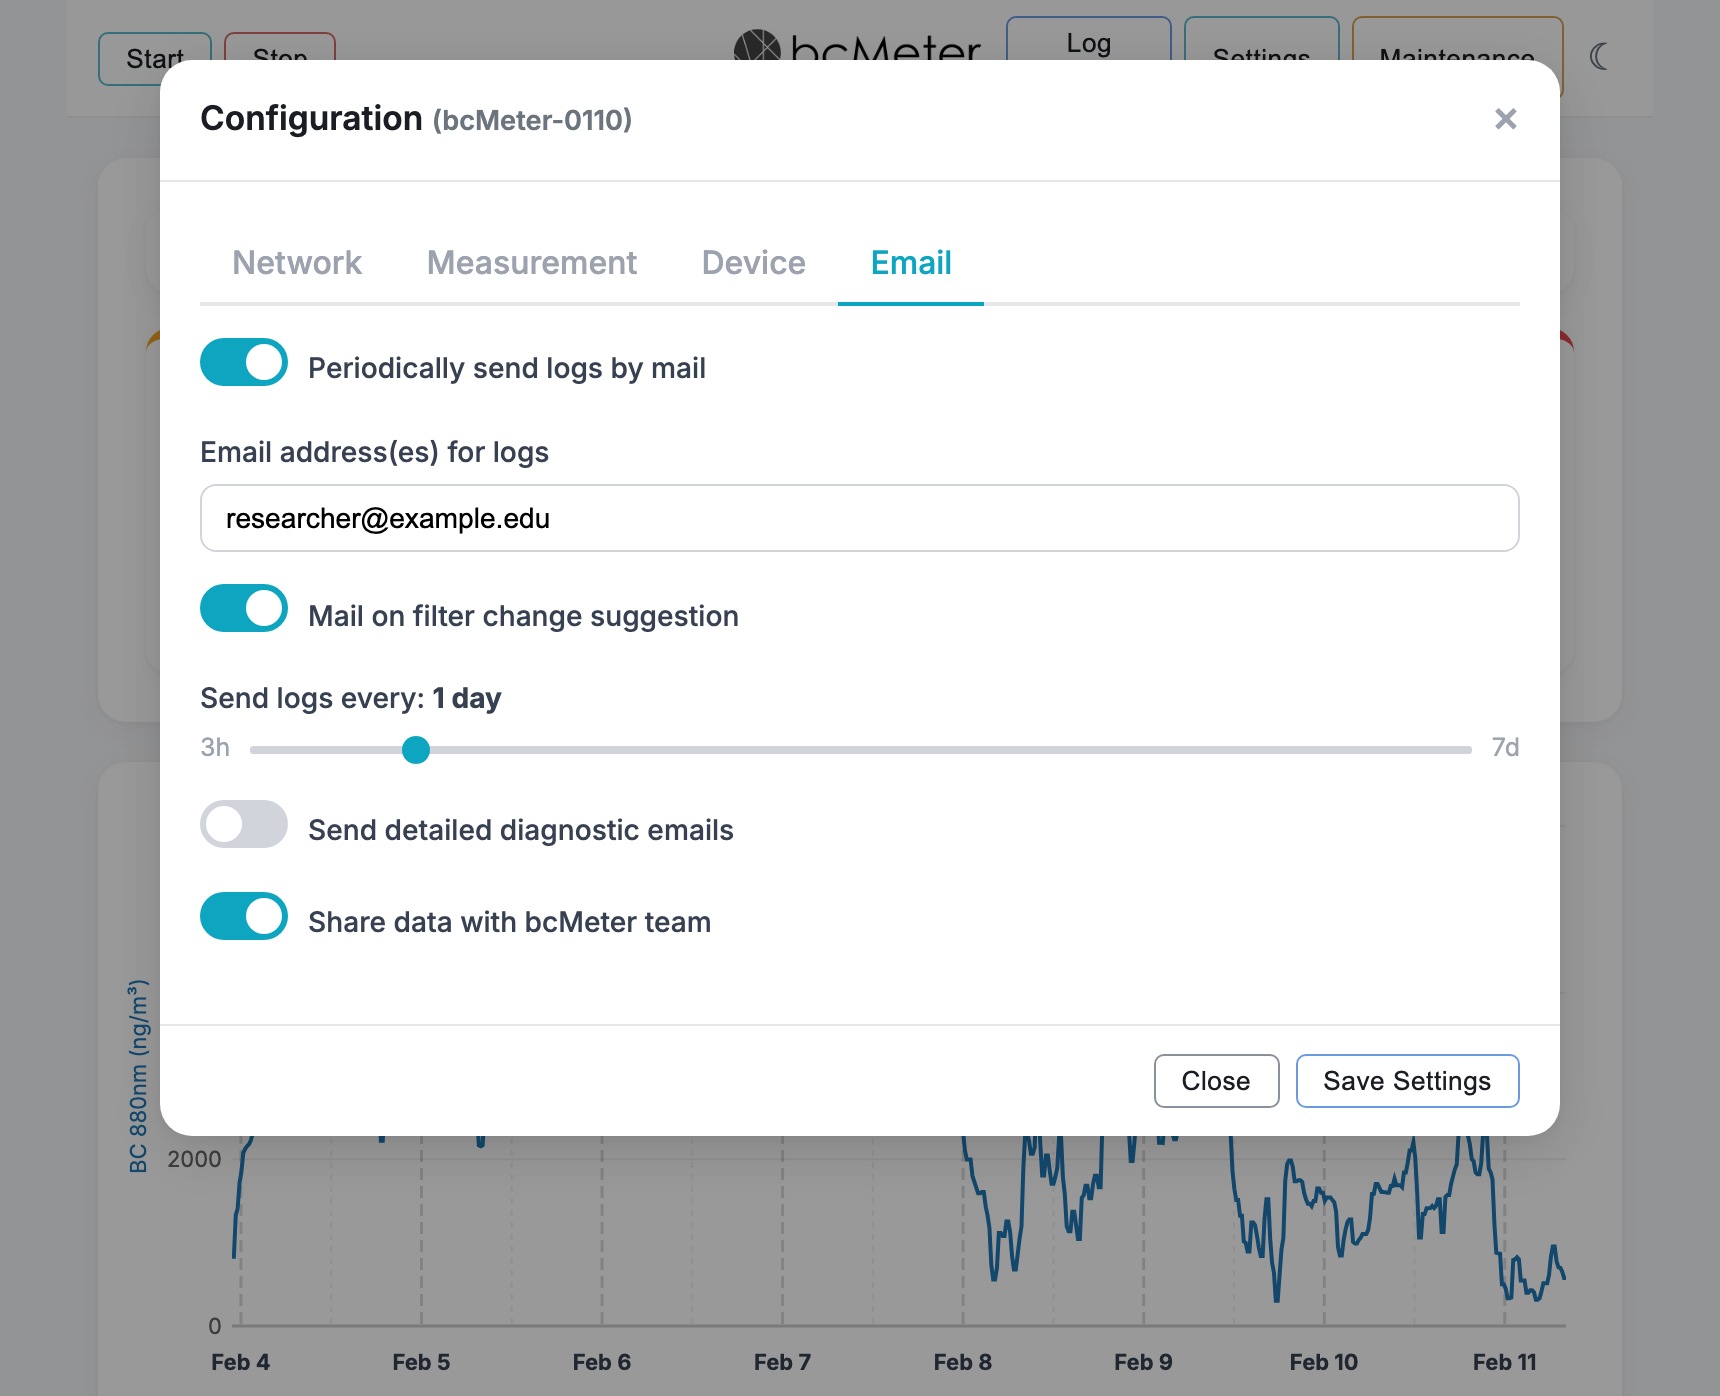
| Periodic log sending | Master switch enabling automatic, timed email delivery. Each log email includes the full current-session CSV and a session plot. |
| Send logs every | Adjustable via slider from 3 hours to 7 days. Default: 24 hours. |
| Recipient addresses | Destination email addresses (comma-separated). |
| Filter status mail | Sends an alert when filter loading exceeds 70%. Alerts repeat every 12 hours and include device name and location. |
| Measurement quality alerts | Sent automatically for severe measurement issues such as an overtemperature shutdown, a rapid reference signal drop, airflow failure, or prolonged negative BC. |
| Detailed diagnostic emails | Adds extra device context to automatic emails. Enable only when support asks for it. |
| Share data with bcMeter team | Share measurement data with the bcMeter project for maps and analysis. |
4.3 System & Maintenance
Access via the Maintenance button in the navigation bar. The modal is organized into cards for device management, system status, time synchronization, and - when location services are active - geolocation.

Device Management
The Device Management card is split into two columns:
Routine Maintenance
- Calibrate Device: Adjusts LED duty cycles to balance sensor and reference signals. Required after each filter change.
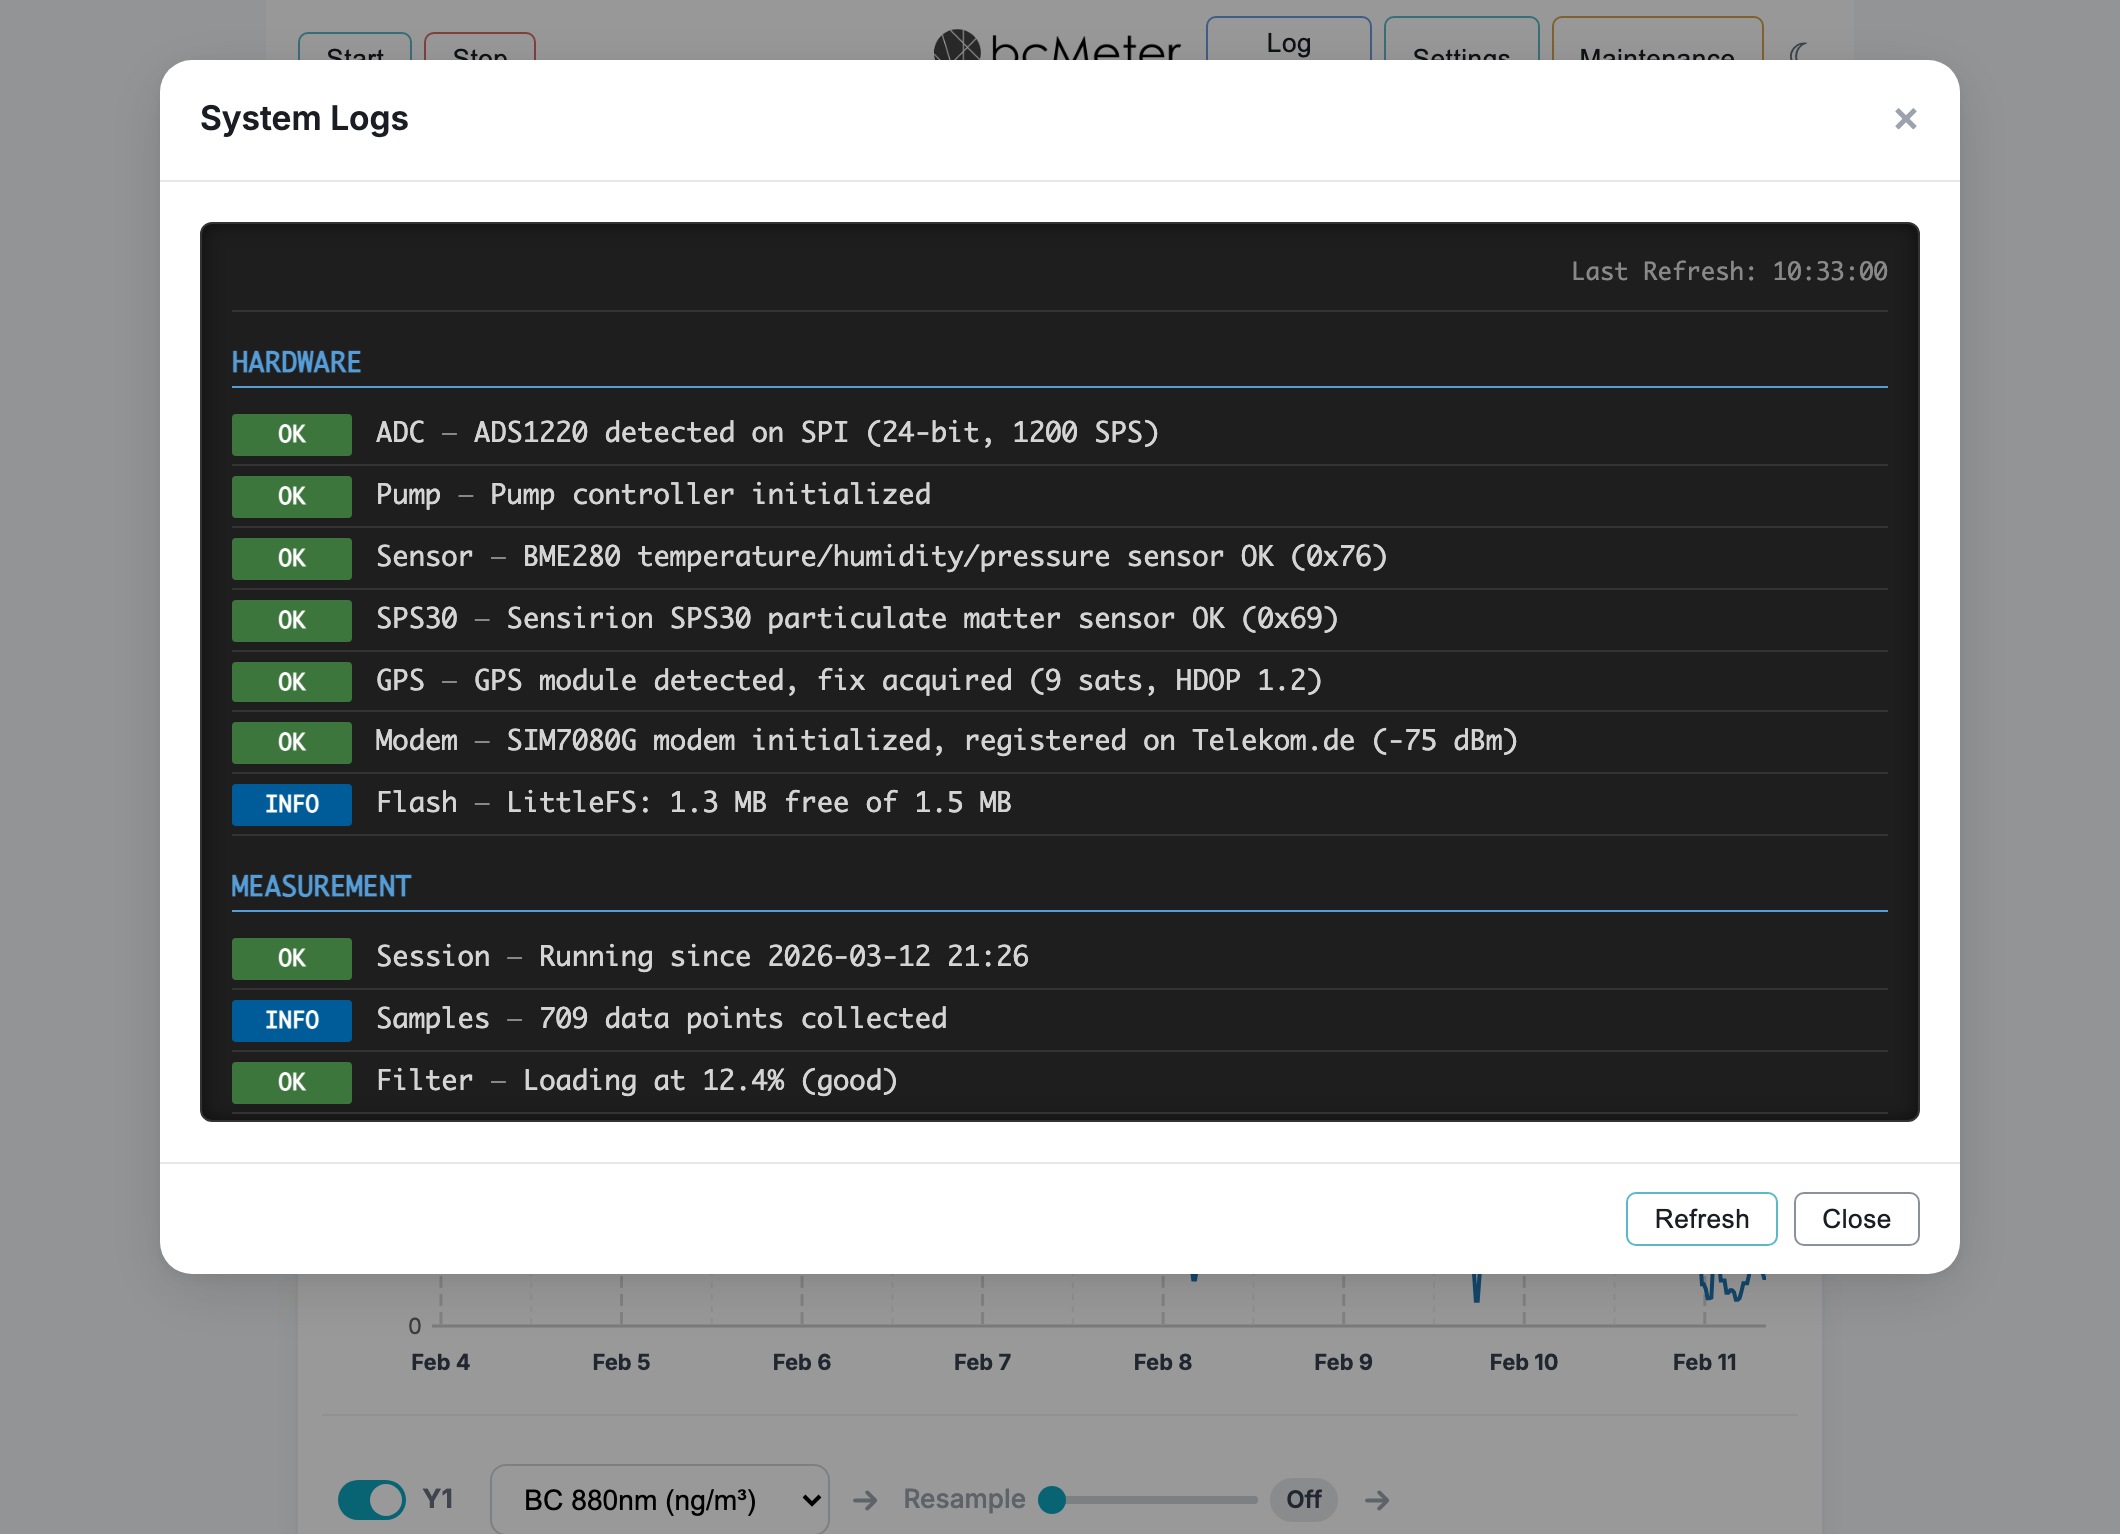
- View System Status: Opens a structured hardware, measurement, system, and network status report.
- Download System Logs: Downloads a troubleshooting report with hardware, measurement, system, and network diagnostics.
- Identify Device: Blinks the device LED for about two minutes, useful when more than one bcMeter is nearby.
System Operations
- Reboot Device: Restarts the device.
- Shutdown Device: Powers down before unplugging. Use this button before disconnecting power.
- Manual Firmware Update: Opens a dialog to upload a firmware file. The device also checks for firmware updates a few times a day and shows a notice when an update is available. If a measurement is active, the update resumes the same session log without repeating optical warm-up; measurement-grid alignment is retained.
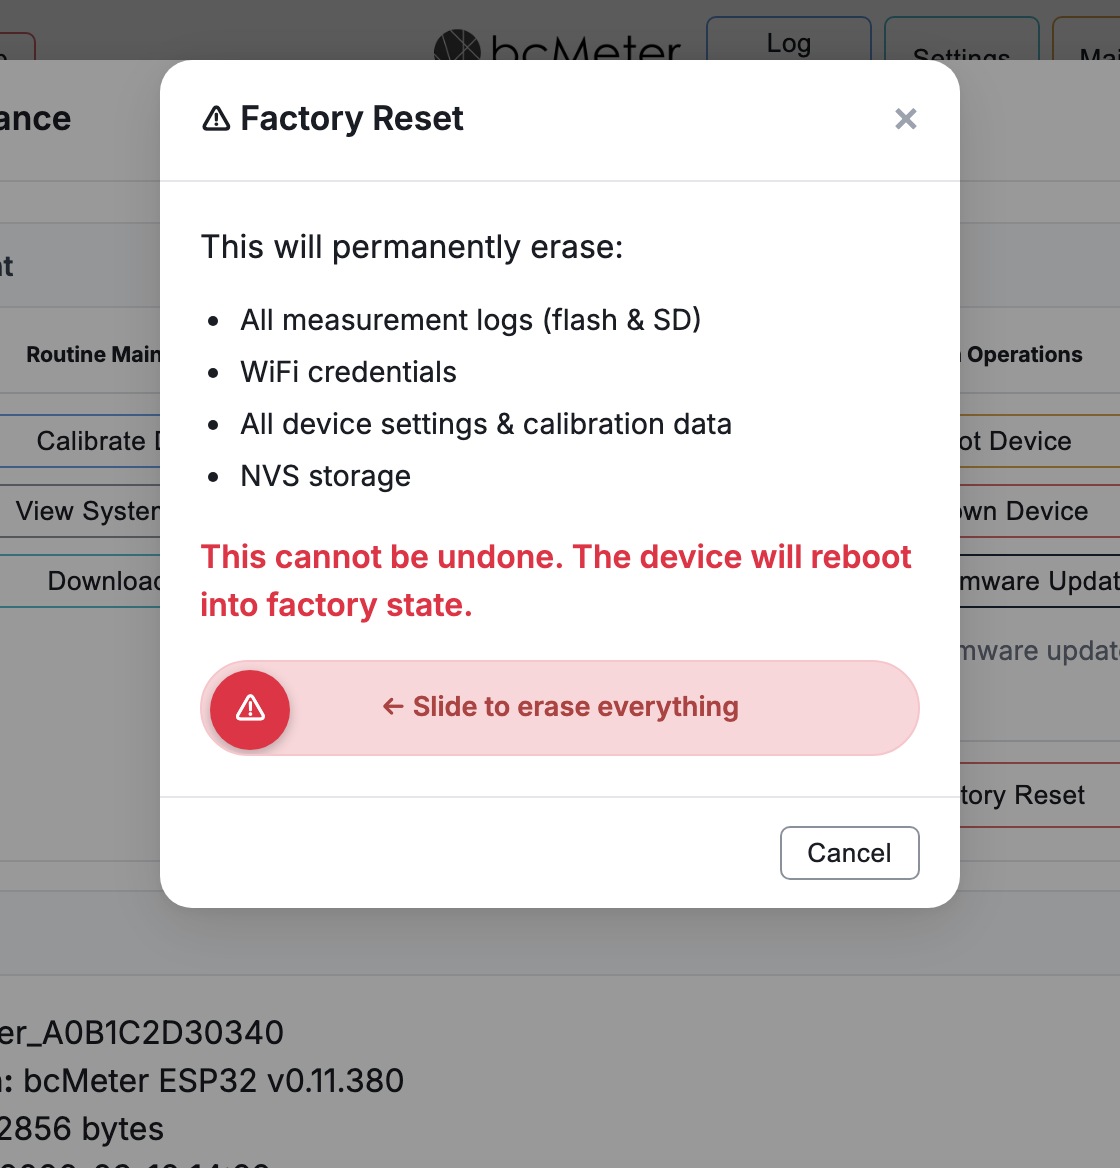
- Factory Reset: Permanently erases all measurement logs, WiFi credentials, calibration data, and device settings. The device will reboot into its factory state. A slide-to-confirm gesture is required to prevent accidental resets.
System Status
Shows the current device state:
- Device ID: Unique hardware identifier.
- Device Name: Current network hostname.
- Software Version: Installed firmware version.
- Free Memory: Available system memory.
- Last Calibration: Timestamp of the most recent calibration.
Time Synchronization
Accurate timestamps need a correct device clock. Devices with internet access sync automatically via NTP. For offline or hotspot-only devices, use manual sync here.
- Browser Time / Device Time: Displays both for comparison.
- Sync: If the mismatch exceeds 10 seconds, a sync button appears to set the device clock from your browser.
Geolocation
When location services are active (Settings > Measurement > Location), the Geolocation card shows position and altitude data. Available fields depend on the installed hardware modules.
- Location: Latitude and longitude with the source and accuracy indicator. Sources vary by hardware: GPS module (optional), cellular modem cell tower lookup (optional, requires 4G module), or IP-based geolocation (available on all WiFi-connected devices).
- Altitude (barometric): Altitude derived from the pressure sensor. Optional - requires a BME280 pressure sensor.
- Altitude (GPS) & Speed: GPS-derived altitude and current speed. Optional - only shown when a GPS module is installed and has a satellite fix.
5. Maintenance Procedures
5.1 Filter Change Procedure
- Identify the side with markings (black line, dot, or circles); if no markings, check the side which is rough
- The marked/rough side must face UP (towards the LEDs/light source in upper optical chamber).
Do not bend or fold the filter. A crease damages the filter surface and alters the particle flow through the paper, both of which cause unreliable measurements.
- Stop any running session.
- Unscrew the top cap of the optical chamber.
- Remove the saturated filter.
- Always check the unscrewed air inlet chamber for filter residue and remove if present; a soft brush may be used for cleaning.
- Insert a single new filter with Markings/rough surface Facing Up. Filter strips can stick together from the cutting process - separate them and make sure only one filter is loaded.
- When screwing the upper air inlet back on, make sure no cables are pinched. Tighten the air inlet chamber only by hand.
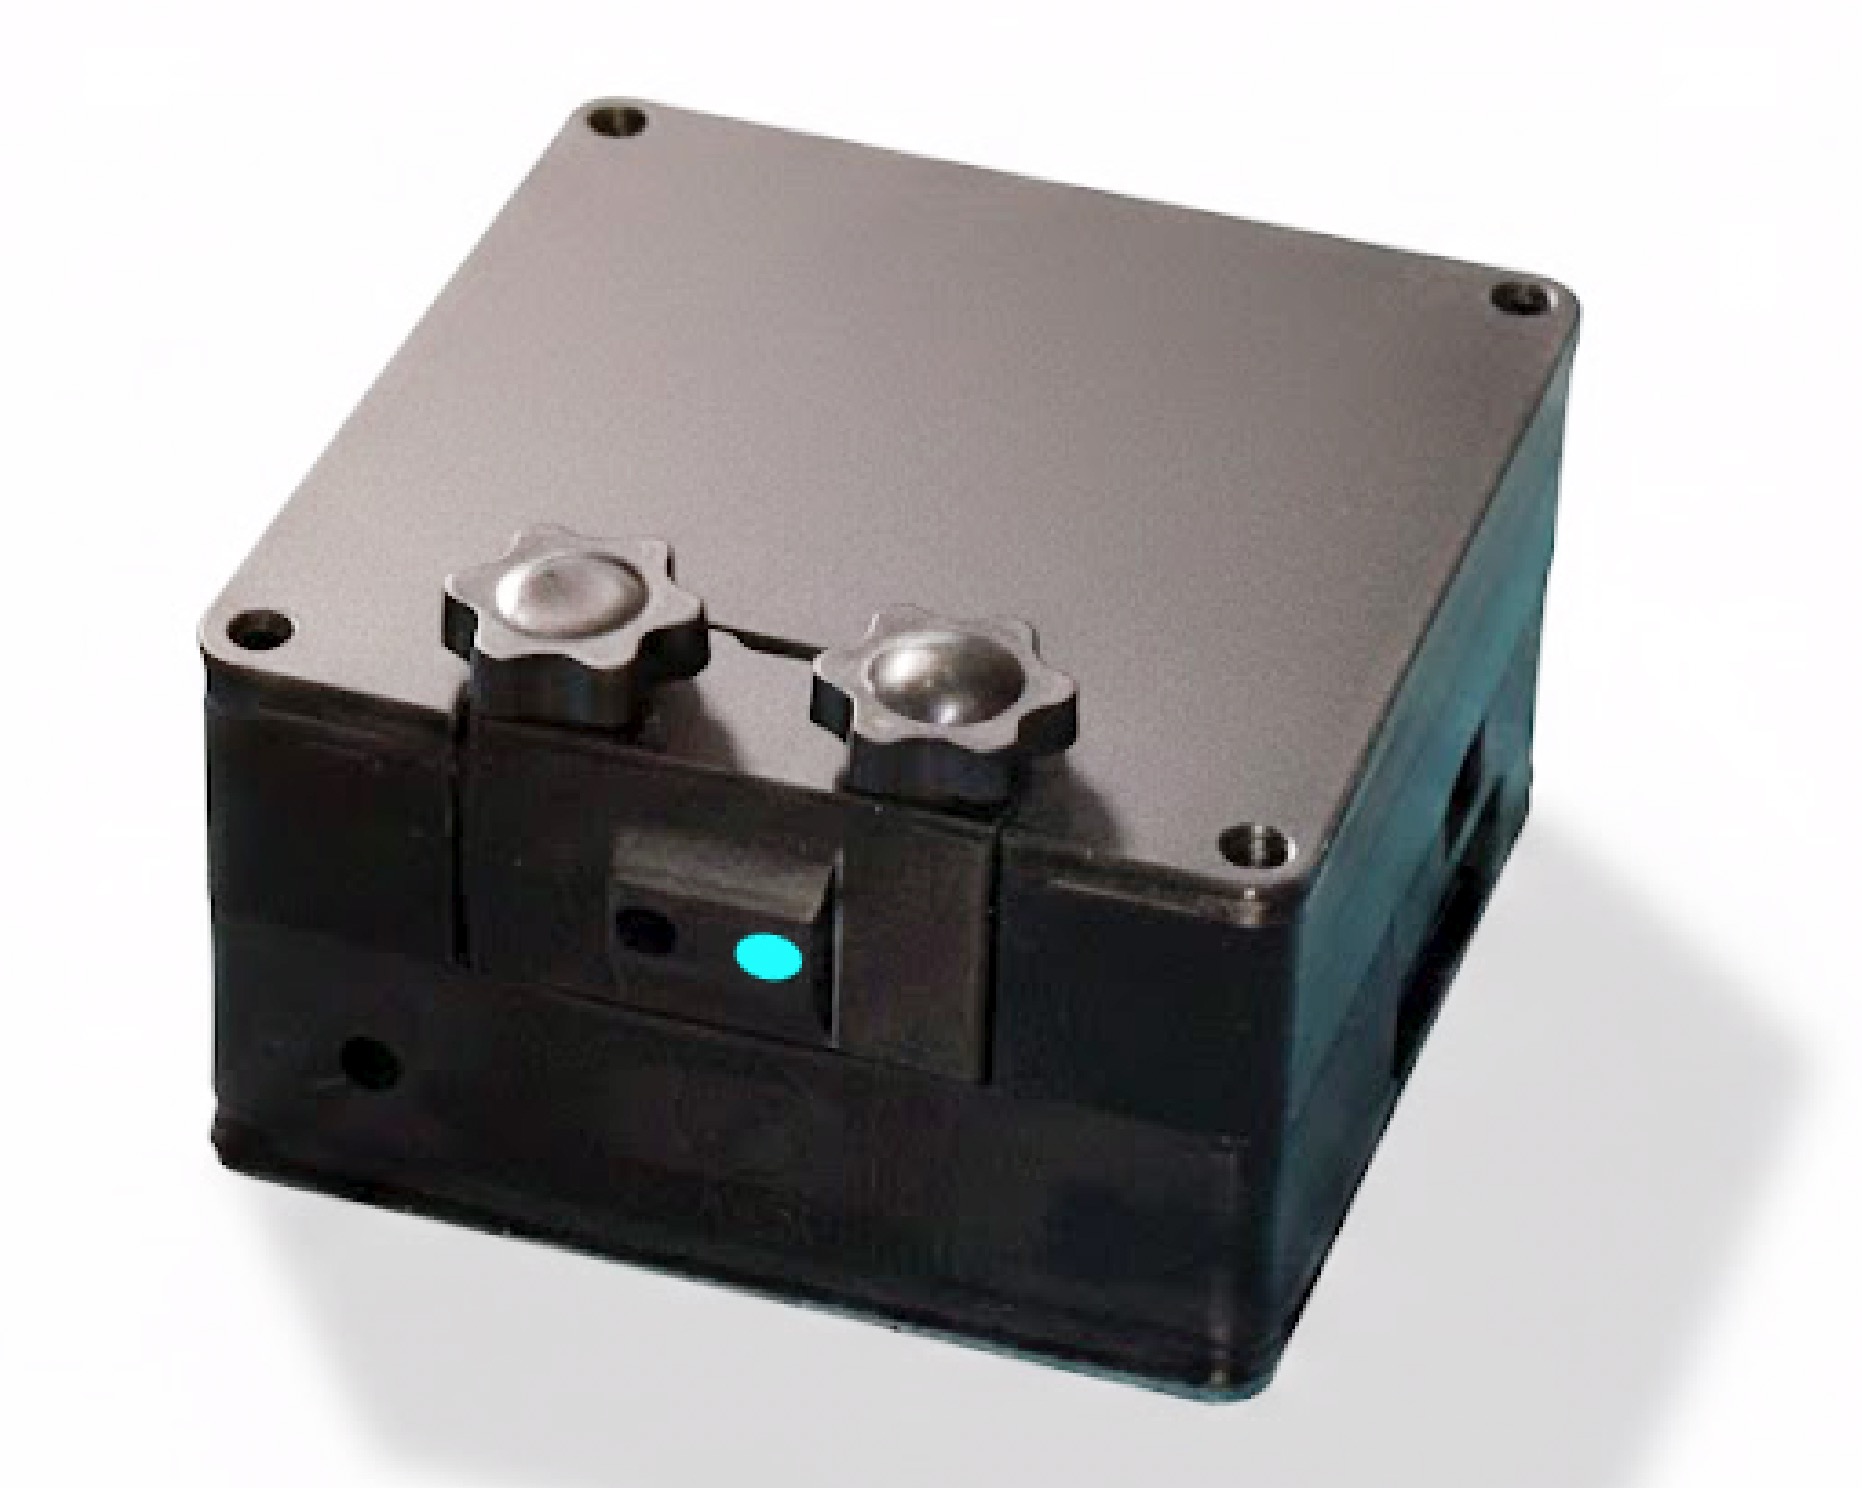
- Check Hose if used: Ensure the air hose remains connected to the inlet port as shown in picture below.
- It is recommended to run calibration after each filter change but at least every 4 weeks (only with fresh filter)
5.2 Calibration
Filters may vary slightly in optical density over their surface and signals may slightly vary over time. Calibration balances the sensor signal against the reference signal for the specific filter currently installed.
- Go to Maintenance > Calibrate Device.
- Ensure a new and clean filter is installed.
- Click "Yes".
- A progress bar will appear. The device adjusts LED intensity.
- Wait for "Calibration Successful" before starting a new log.
A recalibration is recommended every 3 to 6 months and can be booked via bcmeter.org.
5.3 Data Management
Data is stored on the device's internal storage. To manage your session files:
- Click Log Files.
- Logs (>2KB): Valid measurement sessions. Download these for analysis.
- Logs (<2KB): Failed starts or very short tests. These can typically be deleted.
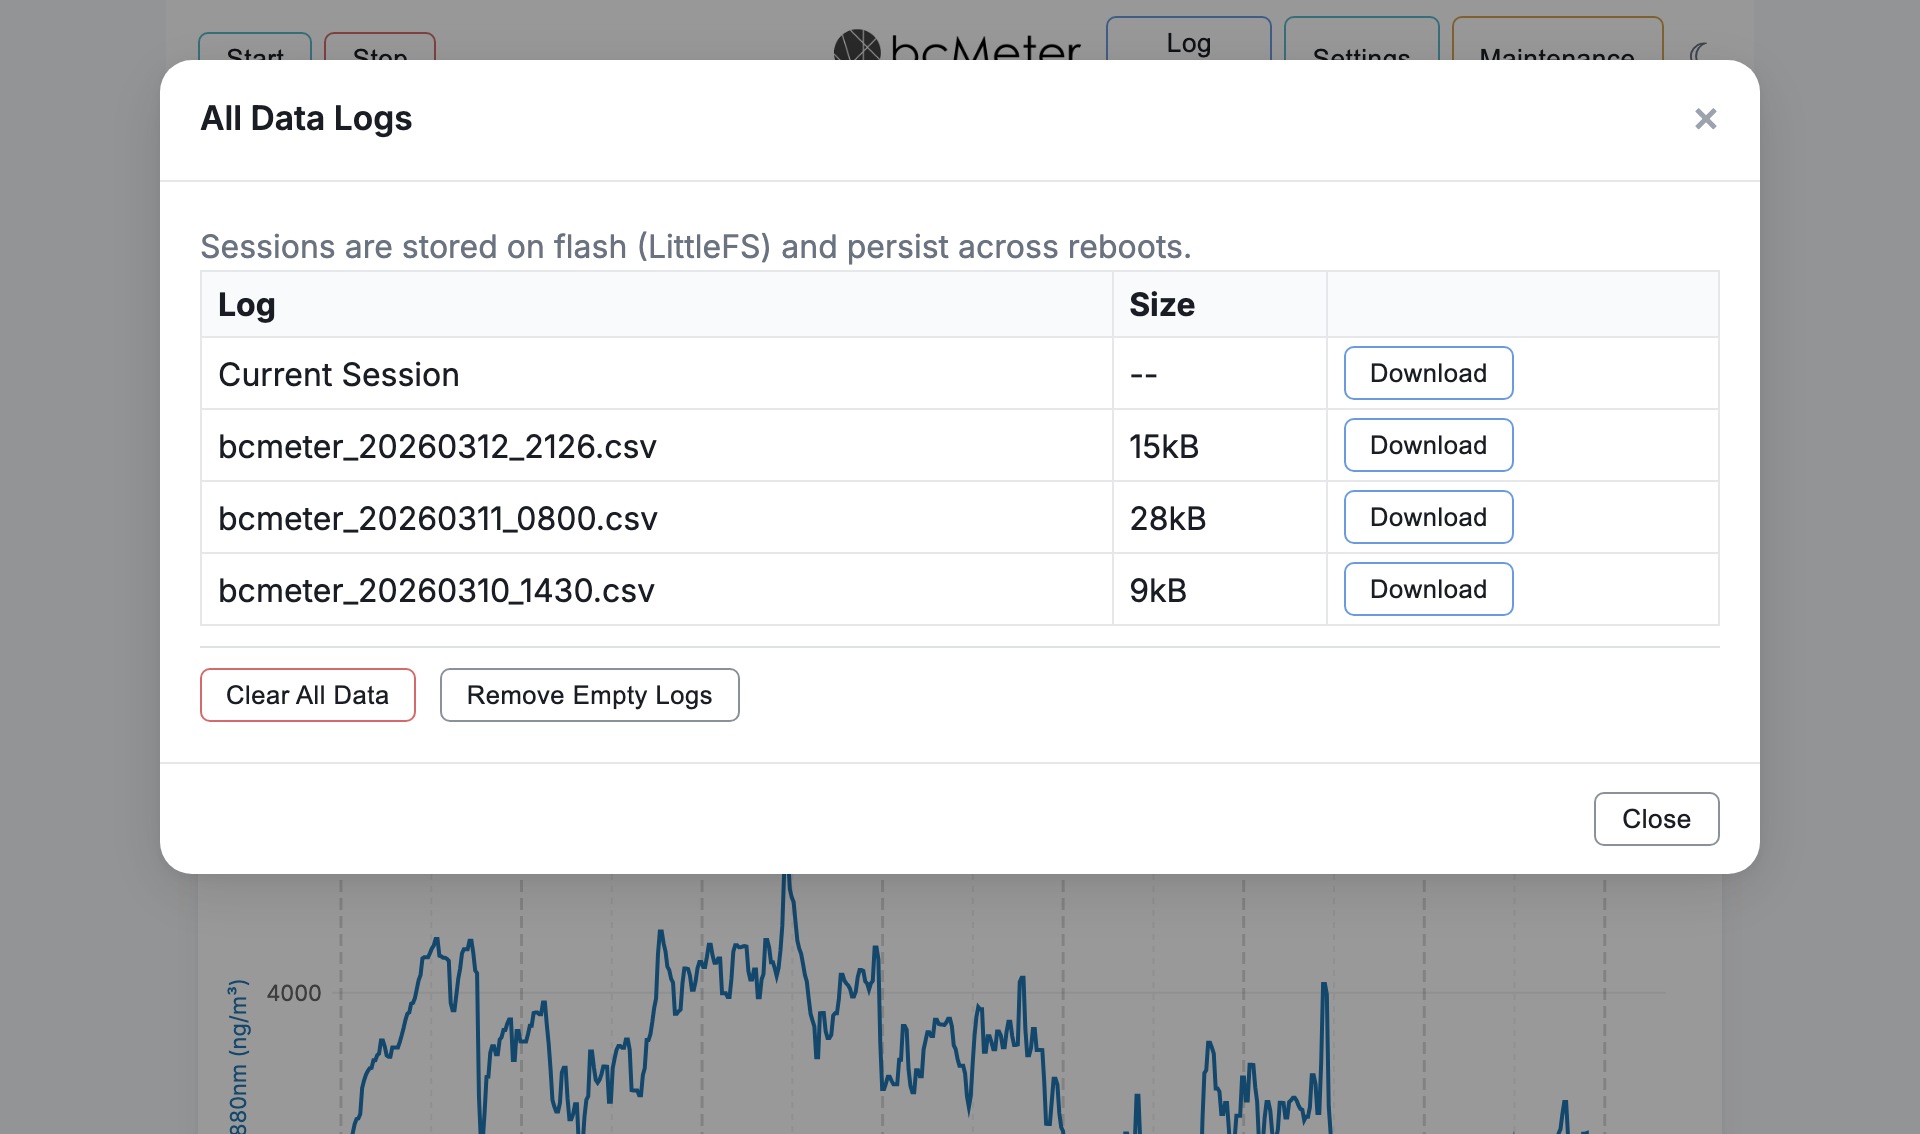
Log files are downloaded as CSV for analysis. The dashboard's Download View button can additionally export the currently visible chart view as CSV, PNG, or SVG. CSV files use semicolon separation with dot as decimal divider. Every CSV download filename begins with the configured full device name, including its -XXXX suffix (for example bcMeter-569C_…csv), so files from different instruments remain distinguishable.
6. Troubleshooting
| Issue | Likely Cause & Solution |
|---|---|
| Negative data over a longer period of time | Environment. Avoid direct sunlight and heat sources (see Section 7 Best Practices). If the issue persists, contact support. |
| Device keeps restarting | Power Supply. Cable too long or thin - see power requirements in Section 2.1. |
| WiFi unstable or disconnects | Voltage instability or weak signal strength. The hotspot may temporarily disappear for 2-3 minutes while self-recovering - it will return automatically. |
| No WiFis listed in setup | Reload the interface to re-initialize the network scan. |
| No Data on Graph | Sampling Interval. The chart needs 3-4 samples before it can render (see Section 3.3). Check that a session is running and wait for the first samples to arrive. |
| Pump noise when stopped | Motor controller logic error (signal state latch). Go to Maintenance > Reboot Device or start a new log and stop right after initialization. |
| Pump stall / no airflow | The device has automatic stall protection. If flow drops below a minimum threshold for 3 seconds, the system attempts recovery by increasing pump power. After 4 failed recovery attempts, the measurement stops with a pump error. The "No Airflow" dialog is shown only for this confirmed flow error. Check for blocked tubing, a saturated filter, or hardware issues. |
| Overtemperature shutdown | At the configured safety threshold (65 °C by default), the device records an overtemperature incident, stops the pumps, closes the measurement session cleanly, and sends one incident email. Let the device cool and keep it away from direct sunlight and other heat sources. This condition is shown as an overtemperature error, not as "No Airflow". |
| Loud pump or rattling during the system check | Expected. The system check deliberately runs the pump hard for a short time to stress-test it and confirm airflow and stall recovery. The noise is intentional and stops when the check finishes - it does not indicate a fault. |
| "Time: not synced" warning | Device clock not synchronized. Internet-connected devices sync automatically; for offline devices, use Maintenance > Time Synchronization (see Section 4.3). |
| Email notifications not working | Check that periodic email sending is enabled and at least one valid recipient address is configured. For bcMeter Kit units, verify the mail service provisioning with the bcMeter team. |
7. Best Practices
Environment
- Keep the device away from direct sunlight, radiators, and fireplaces - it is sensitive to temperature and lighting changes.
- Position the inlet away from localized pollution sources so readings represent the surrounding air.
- For indoor use, avoid placement near HVAC vents or drafts.
Sampling Configuration
- Sample frequency: 180-600 seconds for ambient monitoring. Shorter intervals can increase noise.
- Airflow: The user setting ranges from 50 to 750 ml/min; practical limits are hardware-dependent. Increasing airflow improves signal strength but loads the filter faster.
- Heavy pollution (>2000 ng/m³ average): 50 ml/min works well.
- Typical urban (~500 ng/m³ average): 100-250 ml/min.
- Low pollution (<500 ng/m³ average): increase toward 300-500 ml/min if the filter still lasts long enough.
Signal Quality
- Signal-to-noise ratio improves with: higher BC loads, higher air volume, and smaller sample spot diameter.
- Apply median/average filtering to reduce noise - the rolling average is closer to the "real" value than individual data points.
- Calibrate after every filter change for reliable filter status indication.
8. Resources & Contact
- Project Website: https://www.bcmeter.org
- Technical Wiki: https://www.bcmeter.org/wiki/
- Replacement filter papers & spares: bcmeter.org
- Quick Start Guide / Cheat Sheet: bcmeter_cheatsheet.pdf
Disposal and Registration Information
Return options: In Bearbeitung
- The bcMeter is electrical and electronic equipment and must be collected separately from unsorted municipal waste at the end of its life.
- The crossed-out wheeled-bin symbol means that the device must not be disposed of with household waste.
- Remove any removable batteries, accumulators, or lamps without destroying them before disposal and dispose of them separately. The bcMeter is supplied without a built-in battery or power bank.
- End users are responsible for deleting personal data stored on the device before return or disposal.
Contacts
- Technical inquiries, device availability & manufacturing: Jonas Dahl, Berlin - jd@bcmeter.org
- Black carbon and air quality: Axel Friedrich, Berlin - af@bcmeter.org
9. Legal and Compliance
Intended Use and Limitations
The bcMeter is intended for ambient black-carbon monitoring, research, education, and air-quality screening. It is not a safety device, alarm, certified reference method, medical device, or legal metrology instrument. Do not use bcMeter readings as the sole basis for safety, regulatory, occupational-exposure, emergency, or enforcement decisions.
Power and Connection Requirements
Use only the power supply shipped with the device or a bcMeter-approved replacement. bcMeter Kit and Complete units use 12V / 2A DC or USB-C PD depending on the supplied hardware. Do not use damaged cables, long or thin improvised extensions, power banks, or unapproved chargers. Connect power before starting a measurement. If the device repeatedly restarts, reports brownout, or fails to reach idle state, disconnect power and contact support.
Operating Environment and Case Position
Place the device on a stable surface. Keep the device body away from direct heat, flame, water spray, condensation, heavy dust, strong vibration, and direct sunlight; place the sample inlet so it represents the air you intend to measure. The rugged case may remain open during operation and this can improve ventilation. Continue open-case operation only when the device is stable and there are no loose internal parts, damaged cables, liquid contamination, unusual heat, smell, or noise.
Air Path and Measurement Validity
Before each session, check that the inlet, hose if used, fittings, filter chamber, and outlet are connected, unobstructed, not kinked, and not leaking. A blocked, leaking, or disconnected air path can invalidate readings and can stress the pump. Stop the session and correct the air path if airflow or filter warnings persist.
Data Handling
Measurement logs can contain timestamps, device name, measurement values, status codes, and location data if location services are enabled. When email delivery, cloud upload, or data sharing is enabled, logs may be transmitted to configured recipients or the bcMeter project. Operators who do not want external transfer must leave those features disabled or operate without internet access. WiFi credentials, mail-service credentials, service credentials, and security-sensitive diagnostics are not exposed through normal operator read interfaces. Treat downloaded CSV files, plots, and screenshots as shareable measurement records unless the local project procedure classifies them as confidential.
Local Access and Security Boundary
Anyone connected to the bcMeter hotspot or the same operator LAN can view live readings and perform ordinary operator actions such as start, stop, calibration, non-secret setting changes, log download or deletion, reboot, and factory reset. Market units use the individual device/AP password printed on the label; private units may run an open hotspot. Protect hotspot credentials, LAN access, and physical access accordingly. Credentials and security-sensitive values are not displayed in clear text through the normal interface. Security-critical service functions and update-trust changes are controlled service operations.
Firmware Updates and Radio Functions
Install firmware only through the bcMeter interface and only from an approved bcMeter source or support file for the exact device. Do not install demo, development, eBcMeter, display-controller, bootloader, partition-table, merged-flash, or other-product firmware unless support explicitly provides it for this device. A firmware update may stop or interrupt an active measurement; keep power connected until the update has completed. Optional radio functions depend on the supplied hardware and firmware. Do not enable unassessed radio functions or modules unless support provides a controlled release for that function.
Disposal, Take-Back, and Packaging
The bcMeter is electrical and electronic equipment and must not be disposed of with household waste. Use the take-back or WEEE route listed in this manual or contact support for the current return option. Separate packaging materials according to local recycling rules. Delete personal data from the device before return or disposal where local procedure requires it.
Conformity and Support Information
Use the product label, supplied release notes, and current manual revision as the authoritative configuration record. Where a CE-marked bcMeter is supplied, the accompanying documentation must identify the final model, label revision, firmware revision, EU Declaration of Conformity access route, and support or security-update period.